
 1 month ago
11532
1 month ago
11532

Key takeaways:
- Alchemy Pay’s price can reach a maximum of $0.0427 and an average trading value of $0.0364 in 2026.
- The ACH could reach a maximum of $0.0611 and an average of $0.2037 by the end of 2029.
- Alchemy Pay price prediction for 2032 projects a maximum price of $0.2043
Alchemy Pay (ACH) is a cross-functional payment solution making significant strides in bridging the gap between fiat and cryptocurrency payment ecosystems. The platform’s robust framework enables global consumers to connect with merchants, developers, and institutions worldwide, facilitating transactions across multiple fiat currencies and cryptocurrencies. This functionality enhances Alchemy Pay’s adaptability and positions it as a pivotal player in the financial technology sector.
Alchemy Pay’s inclusion in the decentralized platforms of popular projects like Augur, Cryptokitties, and OpenSea, along with its support for Kyber and Radar Relay’s infrastructure, adds layers of credibility and utility, enhancing its investment appeal.
Can Alchemy Pay (ACH) get to $0.1? Will Alchemy Pay hit $1? Let’s find out in this ACH price prediction for 2026-2032.
Overview
| Cryptocurrency | Alchemy Pay |
| Token | ACH |
| Price | $0.005967 |
| Market Cap | $59.67M |
| Trading Volume (24-hour) | $3.97M |
| Circulating Supply | 10 Billion ACH |
| All-time High | $0.1975 Aug 06, 2021 |
| All-time Low | $0.001338 Jul 20, 2021 |
| 24-h High | $0.006098 |
| 24-h Low | $0.005939 |
Alchemy Pay price prediction: Technical analysis
| Price Prediction | $ 0.005912 (-1.32%) |
| Price Volatility | 7.17% (High) |
| 50-Day SMA | $ 0.006669 |
| 14-Day RSI | 41.94 (Neutral) |
| Market Sentiment | Bearish |
| Fear & Greed Index | 23 (Extreme Fear) |
| Green Days | 13/30 (43%) |
| 200-Day SMA | $ 0.01169 |
Alchemy Pay price analysis
TL;DR Breakdown:
- ACH crashed 57% from $0.0140 and is now flatlined near all-time lows of $0.0060 with zero buying interest.
- Both charts show microscopic candles and near-zero volatility — complete market disinterest and no recovery catalyst in sight.
- Hold $0.0058 or risk a drop to $0.0050 — reclaim $0.0070 to spark any bounce.
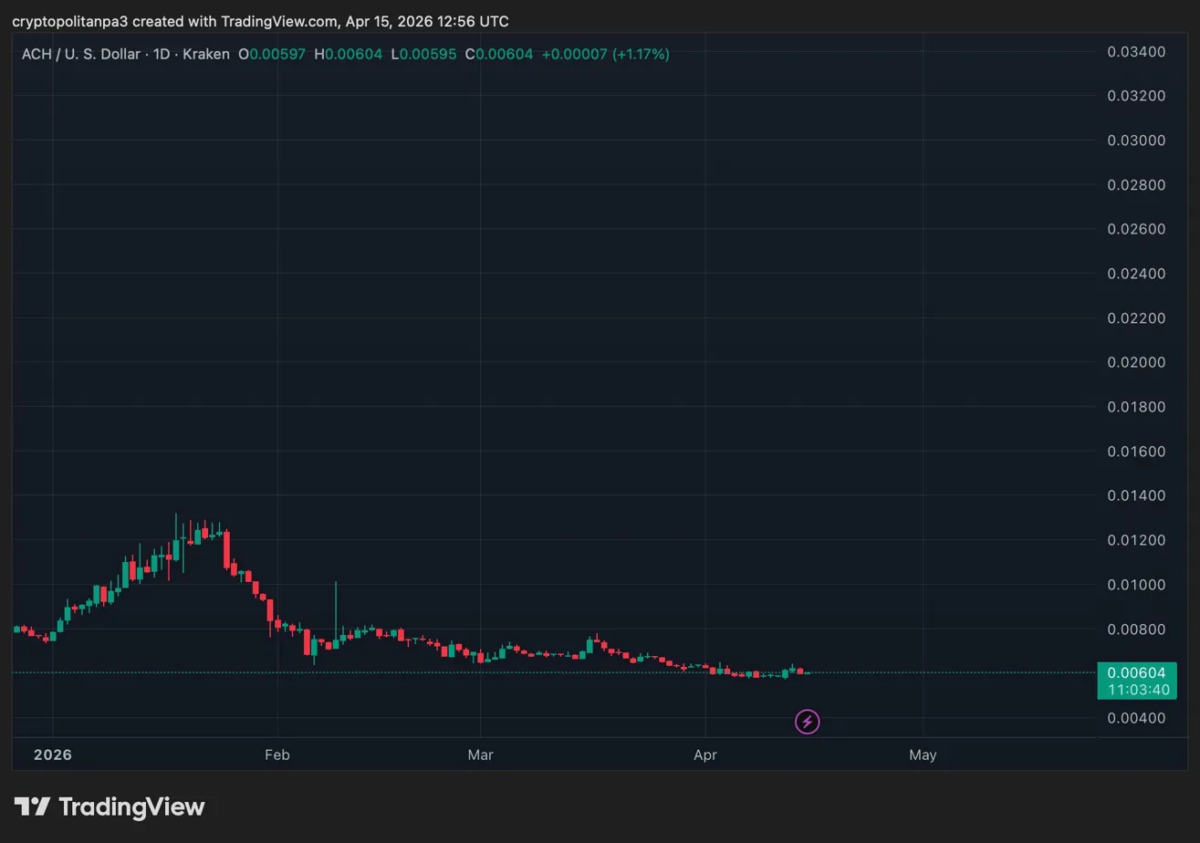
ACH/USD 1-day chart
 ACHUSD chart byTradingView
Alchemy Pay trades at $0.00604, up 1.17%, but the daily chart reveals a catastrophic downtrend since January 2026. Price peaked at $0.0140 in mid-January before collapsing 57% to a February low of $0.0073. A brief recovery to $0.0100 was swiftly rejected, with price then grinding relentlessly lower through March and April toward current levels near $0.0060 — an all-time low zone. Candles are microscopic and flat — deep seller exhaustion with zero buying pressure. Support at $0.0058–$0.0060. A breakdown risks $0.0050. Bulls need to reclaim $0.0070 to show any recovery. Structure is devastatingly bearish.
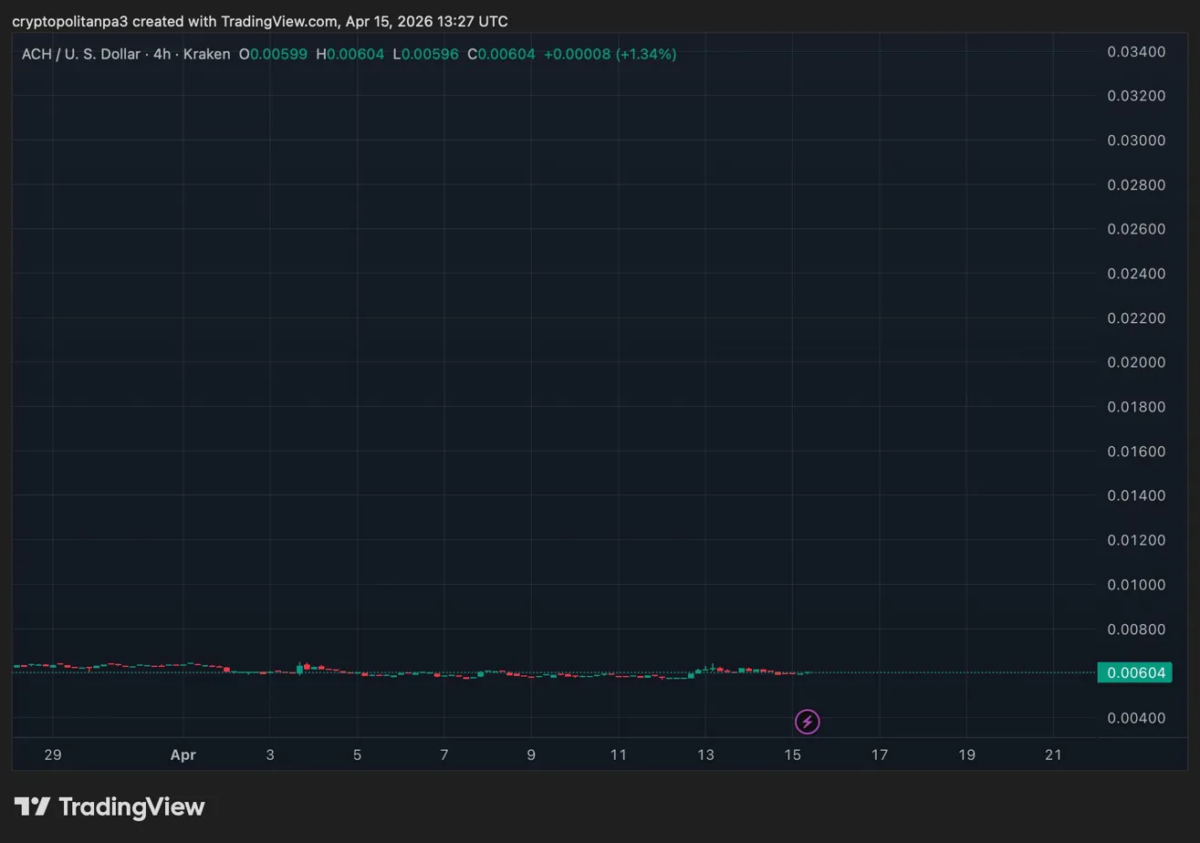
Alchemy Pay 4-hour price chart
 ACHUSD chart byTradingView
Alchemy Pay trades at $0.00604, up 1.34%, with the 4H chart showing one of the most lifeless and compressed price structures visible — an almost perfectly flat line hugging the $0.0059–$0.0064 range for the entire visible period from late March through April 15. Candles are so small they are barely visible — essentially zero volatility and near-zero buying or selling pressure. The entire chart sits at the bottom of the scale with vast empty space above — a deeply concerning visual of complete market disinterest. Support at $0.0058. Resistance at $0.0070. Any meaningful catalyst could trigger a sharp move in either direction — currently fully directionless.
Alchemy Pay technical indicators: Levels and action
Daily simple moving average (SMA)
| Period | Value | Action |
| SMA 3 | $0.006948 | SELL |
| SMA 5 | $0.006392 | SELL |
| SMA 10 | $0.005972 | SELL |
| SMA 21 | $0.006124 | SELL |
| SMA 50 | $0.006669 | SELL |
| SMA 100 | $0.008126 | SELL |
| SMA 200 | $0.01169 | SELL |
Daily exponential moving average (EMA)
| Period | Value | Action |
| EMA 3 | $0.006325 | SELL |
| EMA 5 | $0.006681 | SELL |
| EMA 10 | $ 0.007330 | SELL |
| EMA 21 | $0.007862 | SELL |
| EMA 50 | $0.008708 | SELL |
| EMA 100 | $ 0.01066 | SELL |
| EMA 200 | $ 0.01403 | SELL |
Alchemy Pay price analysis conclusion
Alchemy Pay is in complete price stasis — one of the most extreme compression patterns visible across any token analyzed. The 1D chart shows a devastating 57% collapse from $0.0140 with price now flatlined near all-time low territory at $0.0060. The 4H chart is essentially a straight horizontal line — reflecting near-total market disinterest and abandonment. Without a significant fundamental catalyst or broader market recovery, ACH has no technical case for recovery. A breakdown below $0.0058 risks a flush to $0.0050. Bulls need to reclaim $0.0070+ with meaningful volume to even begin discussing a recovery narrative. Currently this is a token in hibernation.
Is Alchemy Pay a good investment?
Alchemy Pay (ACH) shows mixed signals as an investment. While the current bearish trend and volatility indicate short-term challenges, the solid market capitalization and consistent support levels suggest long-term potential. However, risk-averse investors may prefer to wait for clearer bullish signs or reduced volatility before considering investing in ACH.
Why is ACH down today?
ACH’s modest +1.82% gain today has no coin-specific catalyst driving it — the move is purely a beta-driven bounce tracking the broader crypto market recovery. Trading volume increased 9.20% to $4.6 million — a minor uptick signaling slightly improved market activity but nothing significant. Background fundamentals provide some support — the Keeta Network integration on April 1 adding direct ACH support for USD bank transfers, and the Hong Kong SFC Type 1 license upgrade on March 27 — but neither are driving today’s marginal move. This remains a technical blip within a deeply bearish structure.
Will ACH recover?
ACH may recover if bulls regain control and maintain support above critical levels. While the current outlook remains bearish, a breakout above short-term resistance levels and sustained buying could reverse the negative momentum and signal a potential market recovery.
Will ACH reach $0.05?
ACH is expected to trade above $0.0124 throughout 2027, suggesting significant price appreciation compared to earlier years.
Will ACH reach $0.1?
The price forecasts indicate that ACH could reach a maximum of $0.3667 by 2029. Given the bullish scenario and the projected positive market sentiment and growth trend.
Will ACH reach $1?
The predictions for 2034 show an ACH maximum price of $1. While this indicates significant growth potential, ACH is likely to reach $1 soon.
Does ACH have a good long-term future?
Alchemy Pay (ACH) shows a generally positive long-term outlook, with projected steady price growth over the years. By 2030, ACH’s market cap is expected to increase substantially, suggesting a strong long-term outlook with moderate to strong growth potential.
Recent news/ opinion on Alchemy Pay
Alchemy launches live inside OpenAI’s Codex, enabling builders to create crypto dashboards and Solana asset viewers with one prompt.
Alchemy Pay price prediction April 2026
Alchemy Pay’s price in April 2026 is expected to be at least $0.0046782. Given an average trading value of $0.0126 in USD, the maximum value can be $0.0219
| Month | Minimum price | Average price | Maximum price |
| Alchemy Pay price prediction April 2026 | $0.0046782 | $0.0126 | $0.0217 |
Alchemy Pay price prediction 2026
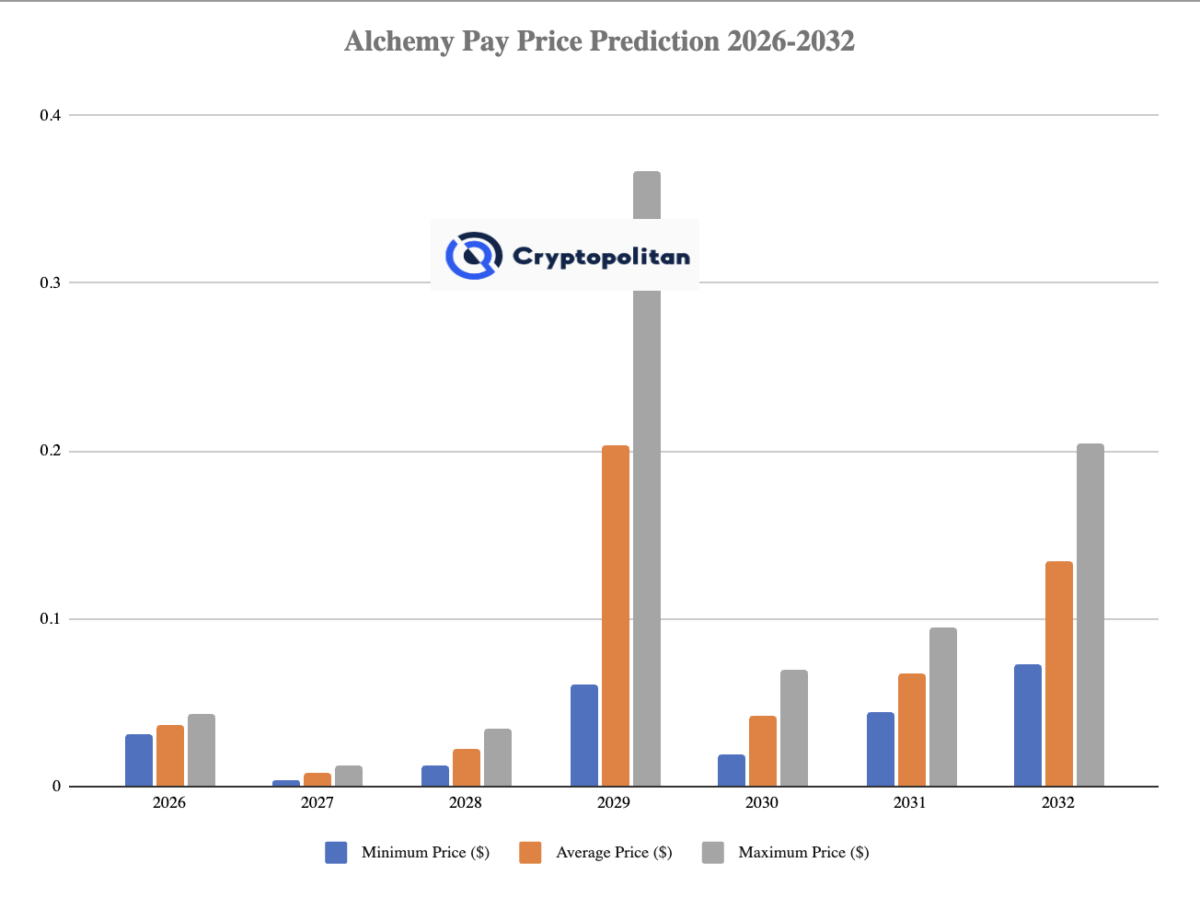
The price of Alchemy Pay (ACH) is predicted to reach a minimum of $0.0309 in 2026, a maximum of $0.0427, and an average trading price of $0.0364. This projection is driven by steady growth in crypto payment adoption, Alchemy Pay’s expanding merchant network, and integration of fiat-to-crypto gateways, while overall market caution keeps price movement moderate.
| Year | Minimum price | Average price | Maximum price |
| Alchemy Pay price prediction 2026 | $0.0309 | $0.0364 | $0.0427 |
Alchemy Pay price predictions 2027-2032
| Year | Minimum price | Average price | Maximum price |
| 2027 | $0.0040422 | $0.0079259 | $0.0124 |
| 2028 | $0.0125 | $0.0229 | $0.0348 |
| 2029 | $0.0611 | $0.2037 | $0.3667 |
| 2030 | $0.0187 | $0.0426 | $0.0699 |
| 2031 | $0.0438 | $0.0674 | $0.0944 |
| 2032 | $0.0733 | $0.1344 | $0.2043 |
Alchemy Pay price prediction 2027
According to the forecast and technical analysis, in 2027, the price of Alchemy Pay (ACH) is expected to range from $0.0040422 to $0.0124, with an average of $0.0079259.
Alchemy Pay price prediction 2028
The price of 1 Alchemy Pay (ACH) is expected to reach a minimum of $0.0125 in 2028, a maximum of $0.0348, and an average of $0.0229.
Alchemy crypto price prediction 2029
According to analysts’ analysis of past ACH price data, in 2029, the price of Alchemy Pay is forecast to range from a minimum of $0.0611 to a maximum of $0.3667, with an average trading value of $0.2037. This projection is driven by the global expansion of crypto-fiat payment systems, the growing regulatory acceptance of digital payments, and Alchemy Pay’s continuous integration with banks, e-commerce platforms, and blockchain networks, all of which contribute to sustainable, long-term growth.
Alchemy Pay price prediction 2030
The price of Alchemy Pay (ACH) is predicted to reach a minimum of $0.0187 in 2030, a maximum of $0.0699, and an average trading price of $0.0426.
Alchemy Pay prediction 2031
Alchemy Pay’s price is forecast to reach a low of $0.0438 in 2031. Based on our findings, the ACH price could reach a maximum of $0.0499, with an average forecast price of $0.0687.
ACH crypto price prediction 2032
The price of Alchemy Pay (ACH) is predicted to reach a minimum level of $0.0991 in 2032, with a maximum of $0.1148 and an average price of $0.1018. This projection is supported by Alchemy Pay’s broad global adoption, integration with major payment networks, and the growing adoption of blockchain-based settlements in mainstream commerce, positioning ACH as a leading solution for seamless fiat-to-crypto transactions worldwide.
 ACH crypto price prediction 2026 – 2032
Alchemy Pay market price prediction: Analysts’ ACH price forecast
| Firm Name | 2026 | 2027 |
| Coincodex | $ 0.007270 | $ 0.007490 |
| DigitalCoinPrice | $0.00737 | $0.0128 |
Cryptopolitan’s ACH price prediction
According to Cryptopolitan’s predictions, Alchemy Pay (ACH) is expected to grow significantly from 2026 to 2032. In 2026, ACH tokens could reach a maximum price of $0.0100. By 2029, ACH could range from
$0.0250 to $0.0309, and by 2032, from $0.0793 to $0.0918, indicating strong long-term growth potential.
Alchemy Pay historic price sentiment
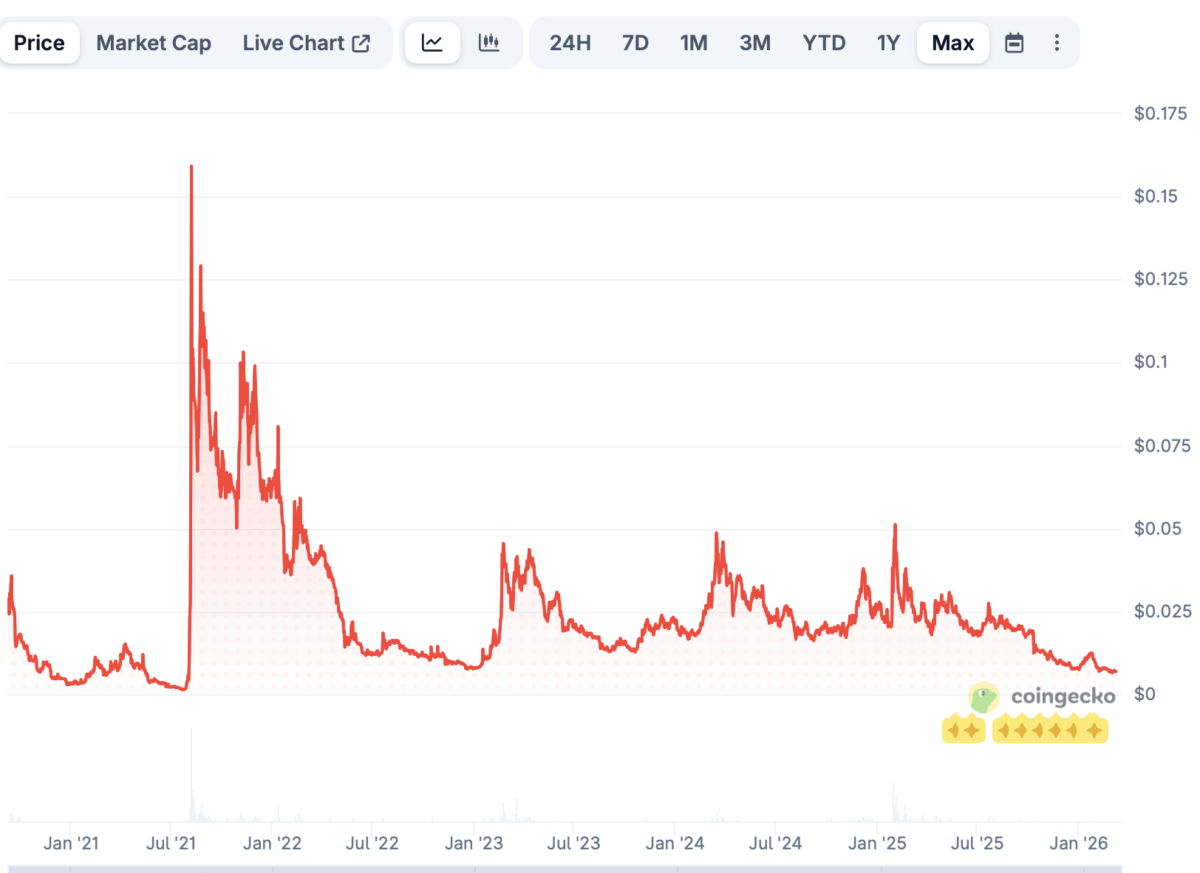 ACH price history by Coingecko
- ACH launched near $0.02 in 2020, slipped to $0.01, then surged to $0.1975 after its Binance partnership before cooling to $0.0628 and closing 2021 around $0.0919.
- In 2022, the price collapsed to $0.0133, recovered to $0.0222, and in 2023 climbed again toward $0.049 before easing back near $0.0303.
- During 2024, ACH fell to $0.0145, rebounded to $0.0216, pushed toward $0.029, and finished the year moving between $0.0205 and $0.0397.
- In early 2025, the token traded around $0.03 to $0.037 before sliding into the $0.016 to $0.024 zone, ending June close to $0.0191 and drifting near $0.020 by August.
- Late 2025 saw a deeper drop to $0.012 to $0.013, followed by a December low near $0.0070 to $0.0078, and a modest rebound to $0.0078 to $0.0082 in early January 2026.
- From January 3 to mid-January 2026, ACH stabilized after its December selloff, trading mostly between $0.0076 and $0.0083 as buyers defended support and volatility compressed following weeks of heavy downside.
- From mid-January to February 7, price action remained range-bound, with mild swings between roughly $0.0074 and $0.0089, suggesting cautious accumulation but no decisive breakout, as overall momentum remained muted.
- From Feb 7, 2026, ACH traded around $0.00737 and moved within a narrow range from $0.0071 to $0.0077 over the following days, as the market showed limited volatility.
- Between mid-February and March 8, 2026, ACH remained mostly stable, trading between $0.007 and $0.008, with sideways price action and mild recovery attempts.
- ACH opened March 3 around $0.0075–0.0080, then spent the first half of March in a tight sideways range before gradually sliding lower through mid-to-late March, hitting lows near $0.0059 by late March as broad crypto selling pressure intensified.
- By April 3, ACH was trading around $0.0060–0.0064, representing a decline of roughly 15–20% over the period, closing the month near its lowest levels since launch, with the overall trend remaining firmly bearish throughout.


 English (US)