
 2 months ago
10240
2 months ago
10240

XRP is showing signs of entering a new bullish phase, with recent price action and long-term chart structure pointing to the potential for a notable upside move.
The outlook is supported by XRP reclaiming the $1.40 level, a key psychological and technical threshold that is reinforcing growing optimism that a broader breakout may be underway.
In this line, analysis of the weekly chart by Crypto Catalysts suggests XRP is breaking out of a long consolidation phase spanning 2022 to 2024.
This was followed by a 2025 rally toward $3 and a subsequent pullback that has stabilized around the $1.30 and $1.40 support zone. The current structure mirrors past cycles where extended sideways movement preceded sharp gains.
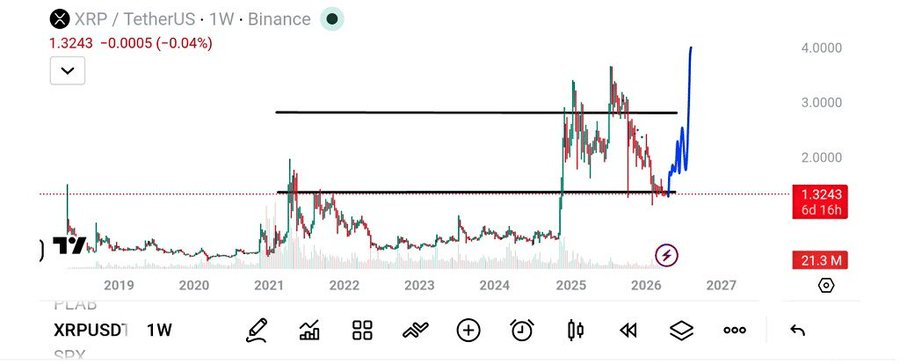 XRP price analysis chart. Source: Crypto Catalysts
With resistance near $3, holding above current support could drive a retest of that level, while a breakout may open the path higher. The analyst’s pattern comparison points to $5 as the next key target.
More aggressive projections place XRP as high as $32, implying a roughly 2,100% surge and a move into trillion-dollar valuation territory.
In this case, the speculative rally would push XRP market cap to almost $1.9 trillion, making the largest cryptocurrency assimung Bitcoin (BTC) record minimal growth over the period.
XRP SuperTrend indicator
The potential for an XRP rally has also been highlighted by crypto analyst Ali Martinez. In an April 18 post on X, he pointed to early signs of a trend reversal after the SuperTrend indicator flipped bullish on the daily chart for the first time since January 17.
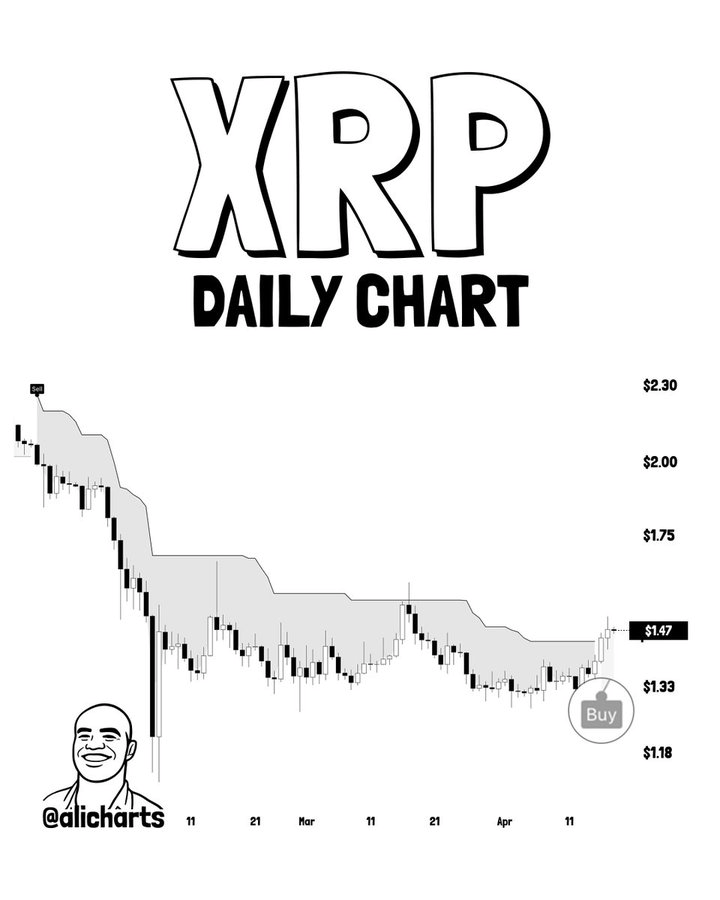 XRP price analysis chart. Source: Ali Martinez
The shift follows months of downside pressure and range-bound trading after a sharp earlier decline.
XRP has since stabilized around the $1.30 and $1.35 support zone, where buyers have consistently stepped in, with price now climbing toward $1.47 as momentum builds and the SuperTrend acts as trailing support.
However, $1.55 remains a key resistance level, having capped recent upside attempts. A decisive daily close above this level could confirm a breakout and trigger a broader relief rally, with the next upside target near $1.90 based on prior resistance zones.
XRP price analysis
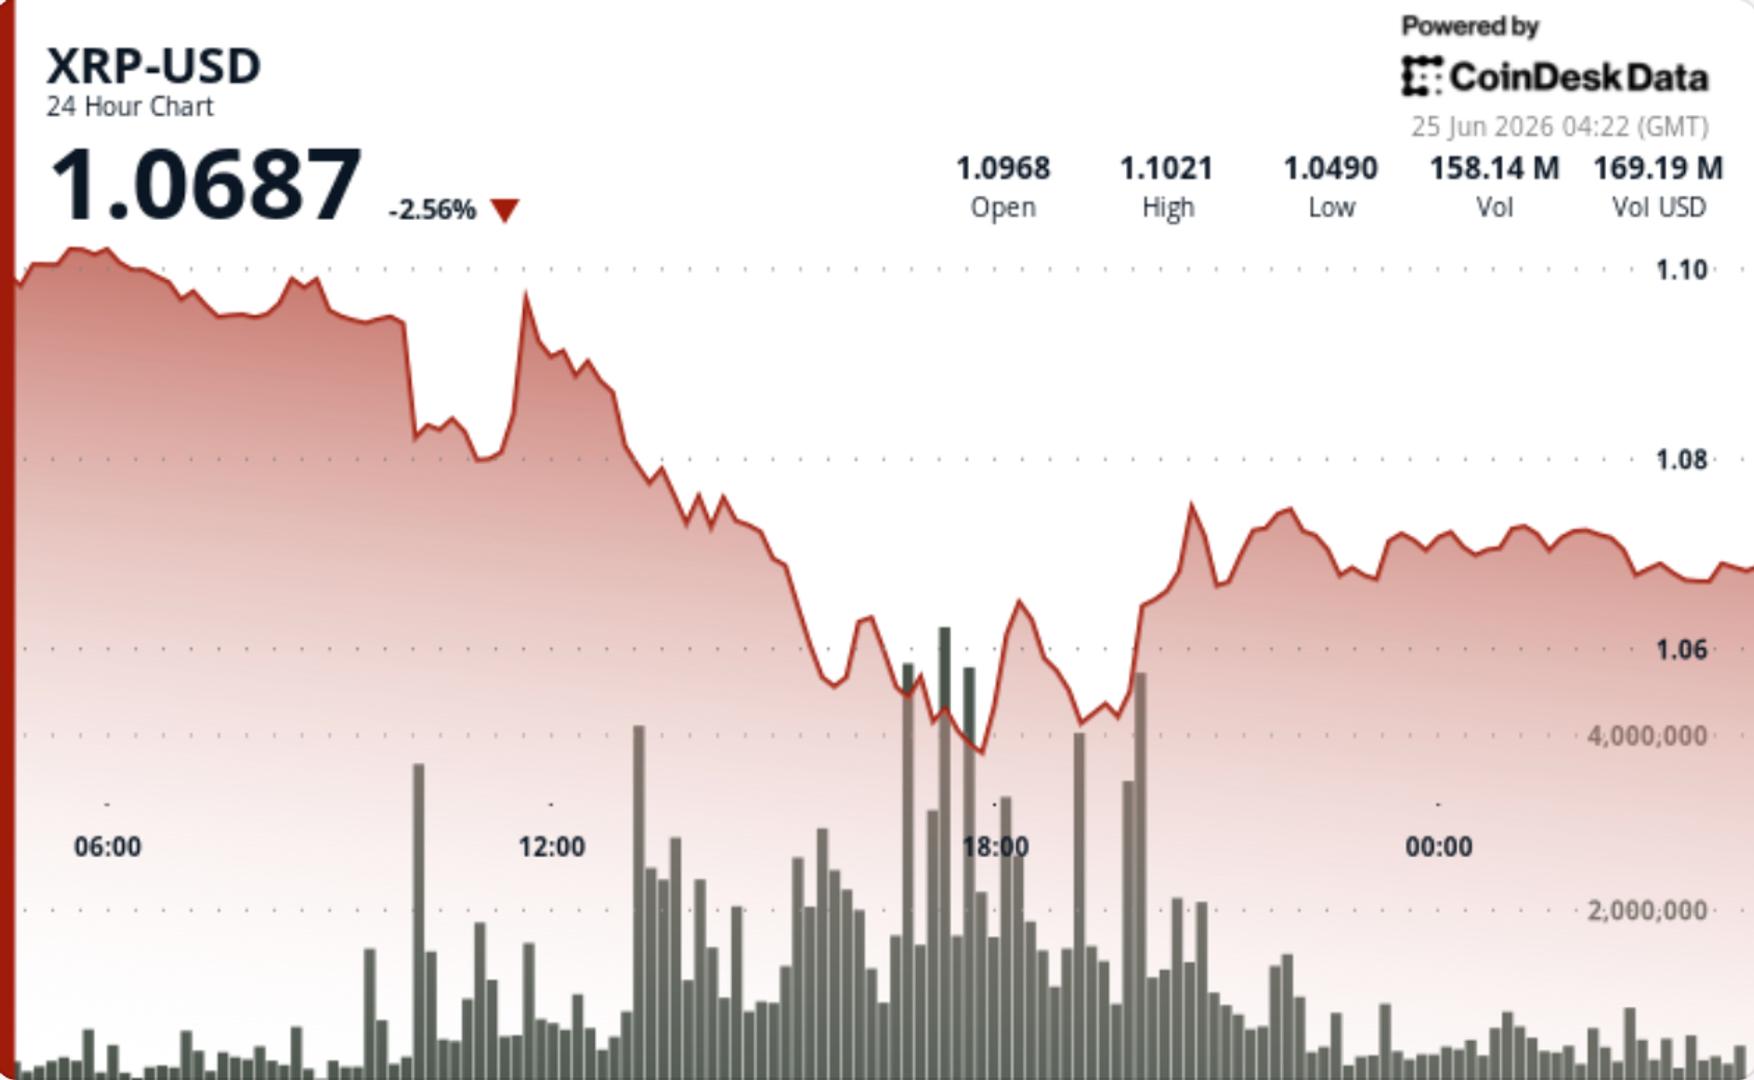
By press time, XRP was trading at $1.43, having dropped about 2.3% in the past 24 hours. On the weekly timeframe, however, the asset remains up over 7%.
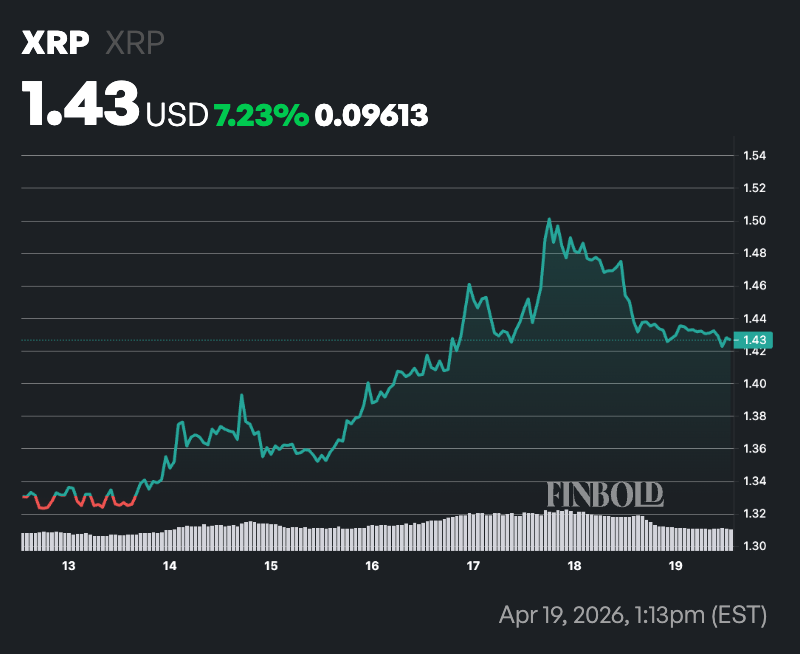 XRP seven-day price chart. Source: Finbold
At the current price, XRP is sitting slightly above its 50-day simple moving average (SMA) of $1.38, suggesting that short-term support is holding and the price retains a modest bullish bias in the near term.
However, the much higher 200-day SMA at $1.90 highlights a broader downtrend, indicating that XRP remains below a key long-term resistance level and has yet to fully regain macro bullish momentum.
The 14-day RSI at 64.94 is neutral but approaching overbought territory, indicating solid buying pressure with room for further gains, though a short-term pullback is possible if momentum begins to fade.
The post Analyst predicts XRP’s upcoming massive 2,100% rally appeared first on Finbold.


 English (US)