
 2 months ago
9990
2 months ago
9990

The original Bitcoin (BTC) Rainbow Chart is pointing to a higher valuation range for the end of April, even as the asset currently attempts to exit a recent consolidation phase below the $70,000 mark.
Notably, the chart suggests that while Bitcoin remains far from overheated territory, it is still positioned in a historically undervalued zone. This positioning leaves room for upward movement should broader cryptocurrency market sentiment strengthen in the coming weeks.
According to the chart’s projected bands for April 30, 2026, Bitcoin’s price ranges are mapped across a spectrum reflecting market sentiment and long-term valuation zones.
At the top end, the “Maximum Bubble Territory” sits at $1,133,102.76, representing extreme overvaluation typically associated with market tops. Just below that, the “Sell. Seriously, SELL!” level at $832,101.42 signals historically overheated conditions where profit-taking has often intensified.
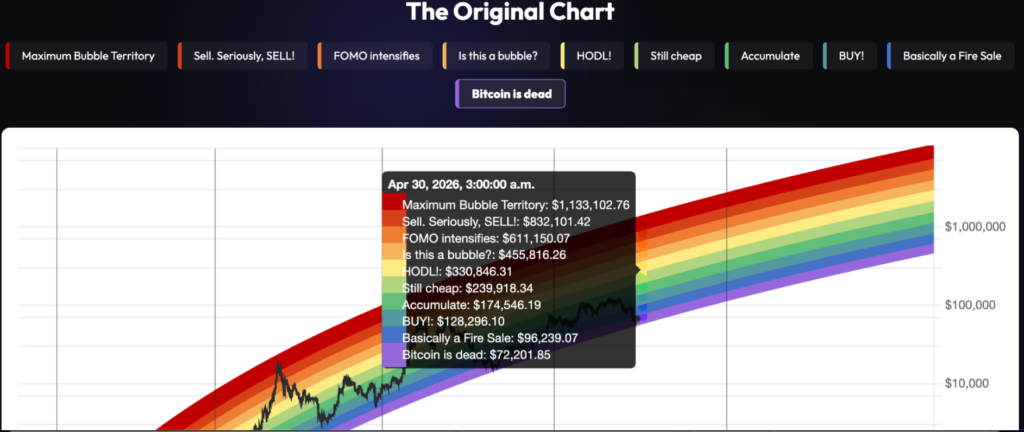 Bitcoin Rainbow chart. Source: BlockhainCenter
The mid-to-upper bands show “FOMO intensifies” at $611,150.07 and “Is this a bubble?” at $455,816.26, both indicating growing speculative demand and heightened investor enthusiasm. The “HODL!” zone at $330,846.31 reflects strong bullish conviction without clear signs of a peak.
Closer to the middle of the spectrum, the “Still cheap” level at $239,918.34 suggests Bitcoin remains undervalued relative to long-term trends. The “Accumulate” band at $174,546.19 and the “BUY!” level at $128,296.10 have historically represented favorable entry zones during earlier stages of market cycles.
BTC hovers near the Bitcoin is dead zone
At the lower end, “Basically a Fire Sale” is positioned at $96,239.07, indicating deep value conditions typically seen during bear markets, while the “Bitcoin is dead” band at $72,201.85 reflects extreme pessimism that has historically coincided with macro bottoms.
Based on these projections, a potential price around April 30 would likely fall within the lower bands if current levels persist.
With Bitcoin trading at $69,800, it is slightly below the “Bitcoin is dead” threshold of $72,201.85 for that date, implying the market is still pricing in significant caution relative to the model’s baseline.
If momentum improves, a move back toward the $72,000 to $96,000 range would align with the chart’s expected trajectory for late April.
Bitcoin price analysis
By press time, Bitcoin was trading at $69,817, having gained over 4% in the past 24 hours. On the weekly timeframe, BTC is also in the green, up 3.5%, aligning with the broader crypto market sentiment.
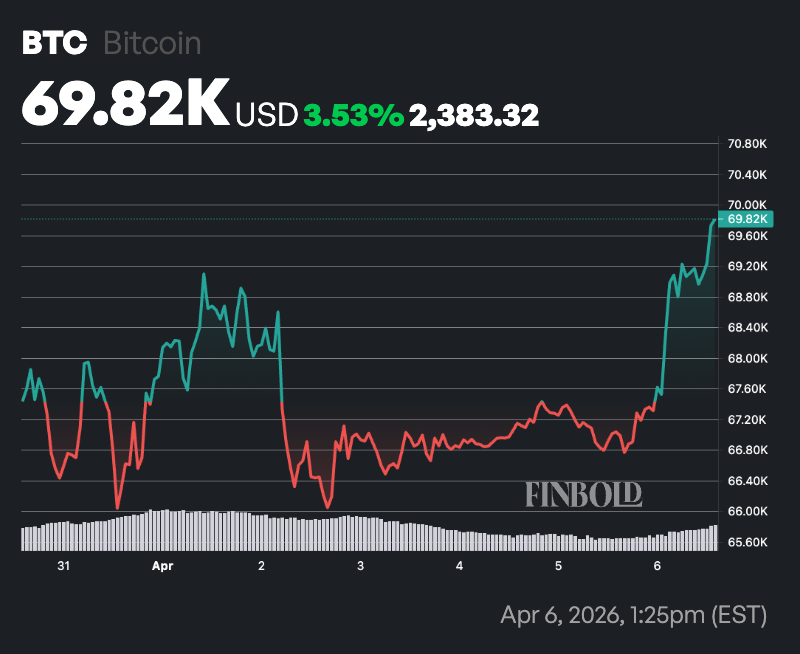 Bitcoin seven-day price chart. Source: Finbold
Following the short-term market rebound, Bitcoin is sitting almost exactly in line with its 50-day simple moving average (SMA) at $69,099. This alignment suggests the market is at a short-term equilibrium, where neither buyers nor sellers have a clear advantage.
However, the much higher 200-day SMA at $90,151 indicates that the broader trend remains under pressure, with the price still significantly below its long-term average.
Momentum indicators reinforce this neutral-to-cautious outlook. The 14-day relative strength index (RSI) stands at 51.54, placing it squarely in neutral territory. This implies that Bitcoin is neither overbought nor oversold, reflecting a market that lacks strong directional conviction.
The post Bitcoin Rainbow Chart predicts BTC price for April 30 appeared first on Finbold.


![KOSPI Index Crash, South Korea Stock Market Bloodbath [LIVE] – 8th June](https://image.coinpedia.org/wp-content/uploads/2026/03/03183804/Korean-Stock-Market-Crash-KOSPI-Plunges-7-Amid-U.S.%E2%80%93Israel-Iran-War-1-1024x536.webp)


 English (US)