
 1 week ago
4034
1 week ago
4034

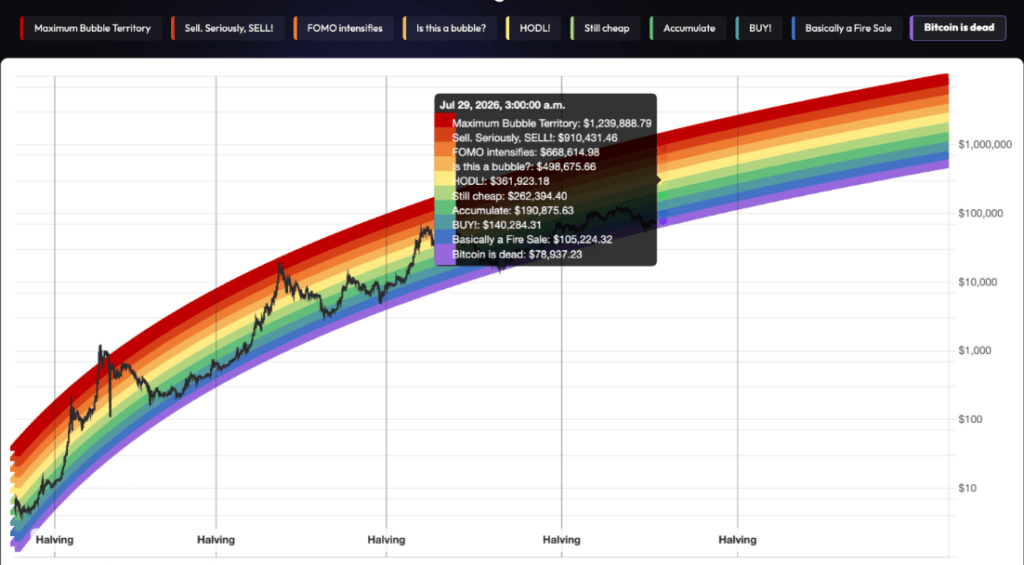
As Bitcoin (BTC) faces renewed bearish sentiment, dropping below the $70,000 mark, the Bitcoin Rainbow Chart suggests the asset remains significantly undervalued relative to its long-term growth trend.
The popular valuation model, which uses logarithmic regression to map Bitcoin’s historical price performance, currently places the cryptocurrency below its lowest projected valuation band for the end of June.
Although the Rainbow Chart is widely followed by long-term investors, it is designed to measure market sentiment and valuation rather than provide precise short-term price targets.
According to the latest projection for June 30, Bitcoin would need to trade at roughly $78,900 to enter the chart’s lowest band, known as “Bitcoin is dead.” This zone has historically represented periods of extreme pessimism when Bitcoin traded well below its long-term trend.
The next band, “Basically a Fire Sale,” sits near $105,000 and reflects levels where Bitcoin is considered heavily discounted.
Above that, the “BUY!” zone around $140,000 and the “Accumulate” range near $191,000 indicate increasingly attractive valuations for long-term investors.
 Bitcoin Rainbow chart. Source: BlockhainCenter
The chart’s middle bands place “Still Cheap” near $260,000 and “HODL!” around $355,000. These areas generally suggest Bitcoin is trading closer to its historical fair-value range rather than at distressed levels.
Bitcoin’s speculative territory
At the upper end of the spectrum, the Rainbow Chart enters more speculative territory. The “Is this a bubble?” band begins around $485,000, while “FOMO Intensifies” sits near $661,000.
The final two zones, “Sell. Seriously, SELL!” at approximately $901,000 and “Maximum Bubble Territory” above $1.23 million, have historically been associated with euphoric market conditions and potential cycle peaks.
With Bitcoin currently trading at $69,397, it sits below even the chart’s lowest projected June valuation band.
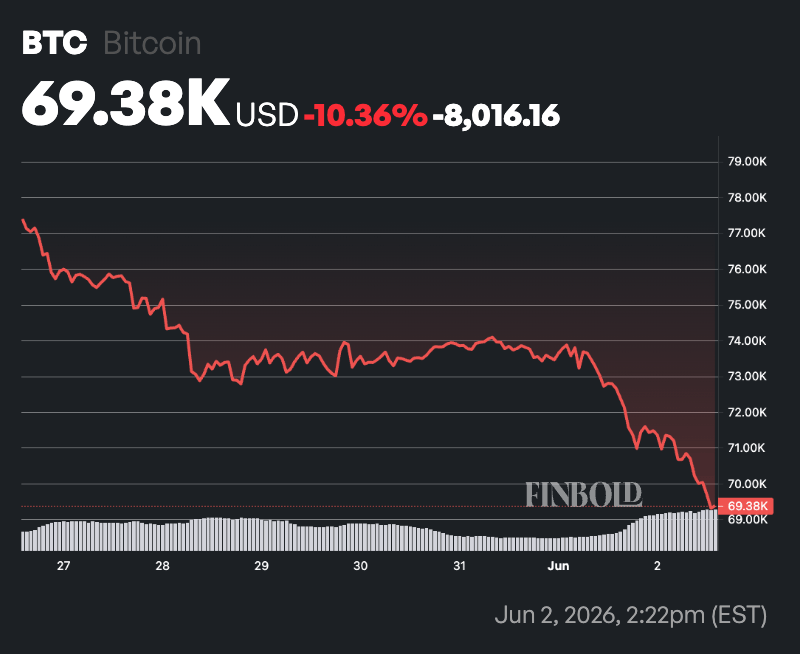 Bitcoin seven-day price chart. Source: Finbold
In practical terms, the Rainbow Chart suggests BTC is trading at a level more bearish than the “Bitcoin is dead” zone, highlighting just how far below its long-term logarithmic growth trend the cryptocurrency currently stands.
However, the Bitcoin Rainbow Chart should not be viewed as a short-term price forecast. With BTC currently trading just below $70,000, the model suggests the cryptocurrency remains significantly undervalued relative to its long-term historical growth trend, rather than signaling an imminent move to the higher valuation bands.
The post Bitcoin Rainbow Chart predicts BTC price for June 30, 2026 appeared first on Finbold.


![KOSPI Index Crash, South Korea Stock Market Bloodbath [LIVE] – 8th June](https://image.coinpedia.org/wp-content/uploads/2026/03/03183804/Korean-Stock-Market-Crash-KOSPI-Plunges-7-Amid-U.S.%E2%80%93Israel-Iran-War-1-1024x536.webp)


 English (US)