
 1 month ago
9879
1 month ago
9879

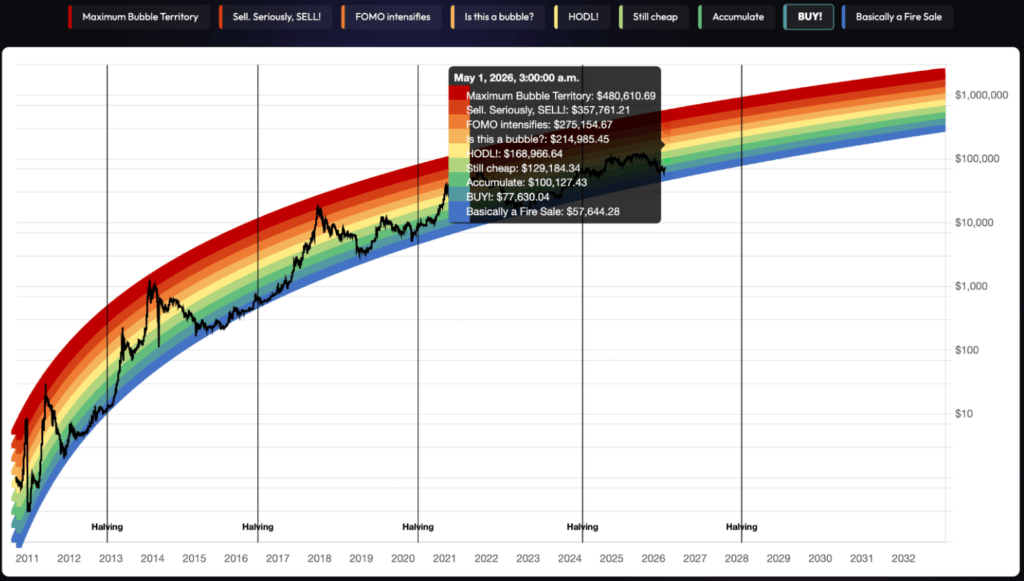
The Bitcoin (BTC) Rainbow Chart is signalling that the asset remains in a mid-cycle zone, with projections pointing to a gradual climb into early May.
The chart, which uses a logarithmic growth curve with color bands to predict price, places Bitcoin within a broad but defined valuation range heading into May 1, 2026.
According to the outlook for May 1, the lowest end, the ‘Basically a Fire Sale’ zone, sits around $57,644.28, representing extreme undervaluation historically associated with cycle bottoms.
Slightly above, the ‘BUY!’ band is marked at approximately $77,630.04, signaling a strong entry zone for long-term investors. The ‘Accumulate’ range follows at about $100,127.43, reflecting continued value buying as confidence builds.
 Bitcoin Rainbow chart. Source: BlockhainCenter
Moving higher, the ‘Still Cheap’ band is positioned near $129,184.34, suggesting the cryptocurrency remains undervalued relative to its long-term trajectory. The ‘HODL!’ zone, often viewed as fair value, is centered around $168,966.64. Beyond this, the ‘Is this a bubble?’ range emerges at roughly $214,985.45, where optimism begins to accelerate.
Further up the curve, the ‘FOMO intensifies’ band is placed at approximately $275,154.67, typically associated with rapid price expansion driven by market excitement.
The ‘Sell. Seriously, SELL!’ zone appears at around $357,761.21, historically aligning with late-stage bullish momentum. At the top of the spectrum, the ‘Maximum Bubble Territory’ peaks near $480,610.69, indicating extreme overvaluation and elevated risk of a sharp correction.
Bitcoin’s ideal May 1 price
Based on these projections, Bitcoin’s current price of $74,193 places it just below the ‘BUY!’ threshold, suggesting it remains in an early accumulation phase relative to the model.
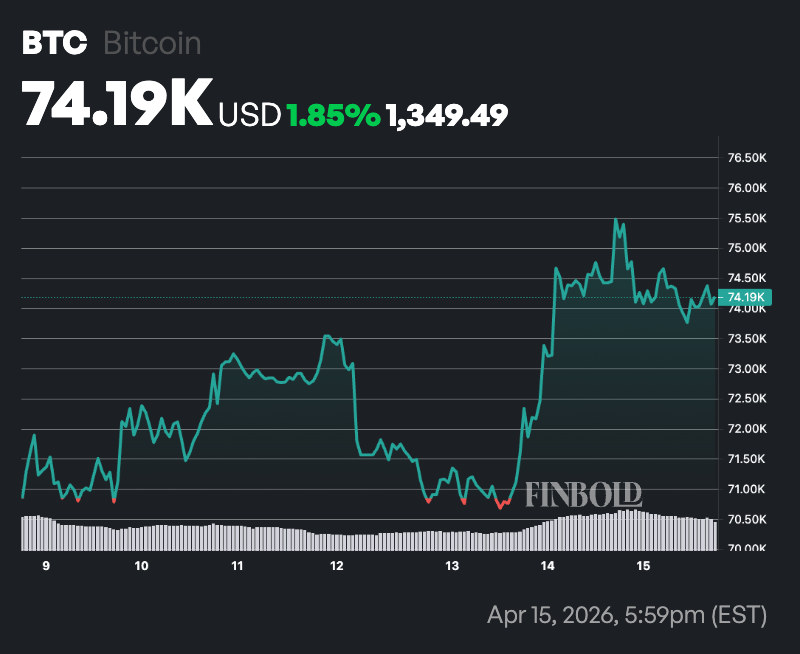 Bitcoin seven-day price chart. Source: Finbold
If the asset trends upward toward May 1, a move into the $77,000 to $100,000 range would align with the transition from ‘BUY!’ into ‘Accumulate,’ marking a strengthening market structure without entering overheated territory.
While the Rainbow Chart does not predict exact prices, it provides a long-term framework for understanding valuation cycles. As Bitcoin approaches May 2026, the model indicates a market that is still building momentum rather than peaking.
The post Bitcoin Rainbow chart predicts BTC price for May 1, 2026 appeared first on Finbold.


![KOSPI Index Crash, South Korea Stock Market Bloodbath [LIVE] – 8th June](https://image.coinpedia.org/wp-content/uploads/2026/03/03183804/Korean-Stock-Market-Crash-KOSPI-Plunges-7-Amid-U.S.%E2%80%93Israel-Iran-War-1-1024x536.webp)


 English (US)