
 2 months ago
9749
2 months ago
9749


The post Bitcoin Trapped Between $69K Support and $75K Resistance — Breakout Move Incoming? appeared first on Coinpedia Fintech News
After a brief rally, Bitcoin price yet again faced a significant pullback and is entering a phase where price action looks quiet. After weeks of choppy movement around the $70,000–$71,000 range, Bitcoin has shifted into a tightening formation, compressing between a descending resistance trendline and rising support. At first glance, this looks like indecision. In reality, it’s a classic setup where volatility contracts before expanding sharply.
On the other hand, the whale order book shows heavy sell pressure stacked between current ranges, while strong builds below the strong support. This explains the recent price action, which is sluggish that fail to follow through and experience repeated rejections. While both buyers and sellers are positioning ahead of the next move, the question arises as to what’s next for the BTC price.
Whale Orderbook Reveals Bitcoin’s Real Battleground
Bitcoin may appear range-bound near $70,700, but the orderbook shows a market driven by uneven liquidity rather than stability. The $71,000–$72,000 zone is thin, meaning there are not enough orders to absorb price movement, which explains the recent choppy and reactive behavior. Small moves push price quickly, but they fail to sustain because there is no depth to support continuation. This is not indecision—it’s a lack of liquidity in the middle of the range.
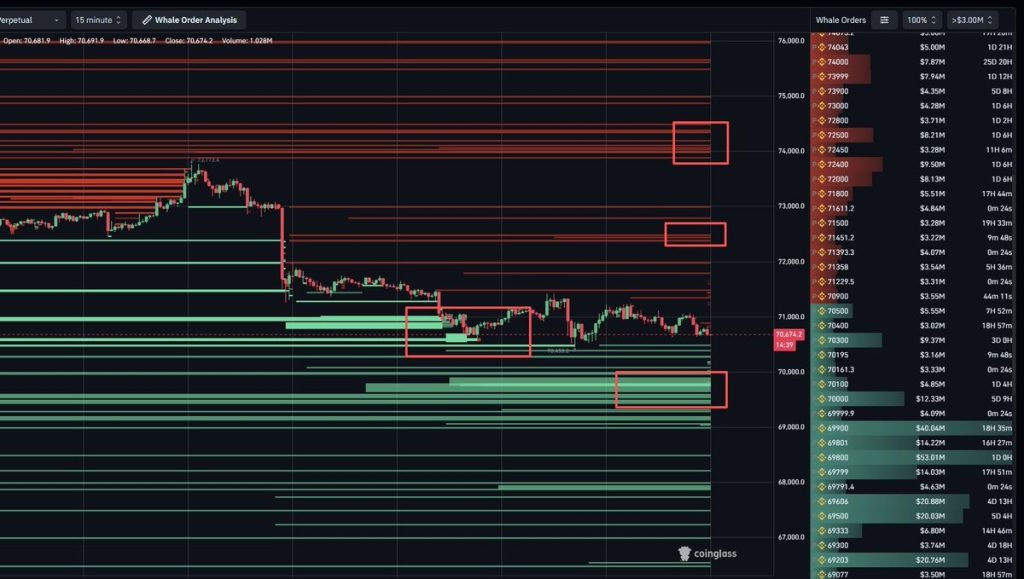
The real activity sits at the extremes. Heavy sell walls between $74,000 and $75,000 form a strong resistance cluster, while large bids around $69,000–$70,000 provide a solid support base. This leaves Bitcoin positioned in a liquidity gap, where price is likely to move toward either side once momentum builds. In this setup, markets don’t drift—they get pulled toward high-liquidity zones, making the next move less about direction and more about which side gets triggered first.
Bitcoin Structure Tightens as Price Nears Breakout Point
Bitcoin is no longer trending—it’s compressing into a decisive zone. The daily chart shows a clear symmetrical triangle, with price squeezed between descending resistance near $71,100–$71,500 and rising support from the $60,000 lows. Currently trading around $70,800, Bitcoin is approaching the apex of this structure, where price typically runs out of space and is forced into a directional move. This tightening range reflects declining volatility, but not weakness—rather, it signals that the market is preparing for expansion.
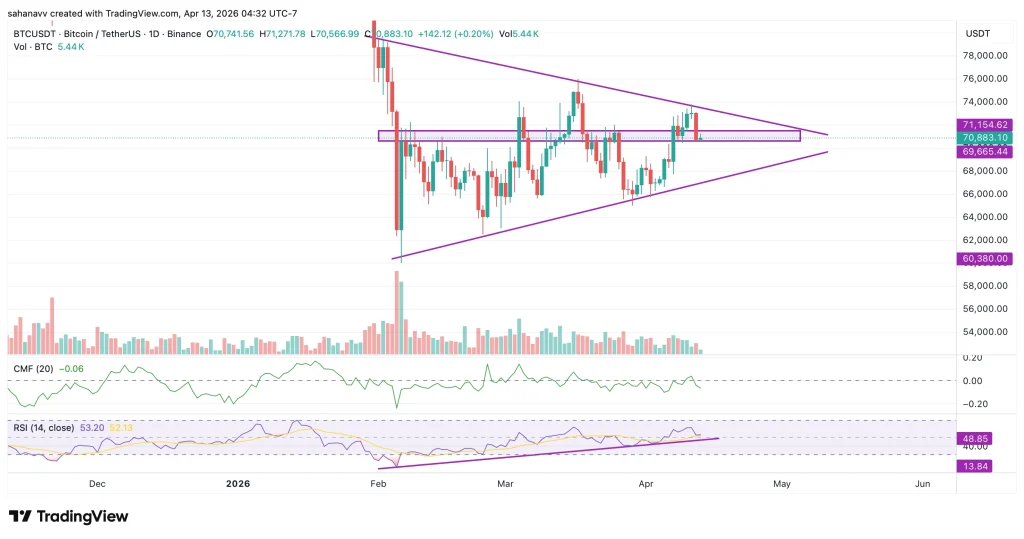
Momentum indicators reinforce this neutral but tense setup. RSI is holding around 52–53, showing no strong directional bias, while the CMF remains slightly negative, indicating cautious capital flow rather than aggressive buying. This combination suggests that neither bulls nor bears are in control yet. However, as the structure compresses further, this balance becomes unstable. Once the price breaks out of this triangle—either above resistance or below support—the move is likely to be sharp, as built-up pressure releases into a liquidity-driven expansion.
Wrapping it Up: Here’s What’s Next for the BTC Price?
Bitcoin price is no longer in a trend—it’s in a decision zone where structure and liquidity are about to resolve.
If Bitcoin breaks above $71.5K–$72K, it enters a low-resistance zone and likely moves quickly toward the $74K–$75K liquidity cluster, where heavy sell orders sit. That’s your upside target, but also where rejection risk increases. On the downside, a loss of $69K support confirms structural breakdown and opens the path toward $66K, with a deeper move into the $60K–$62K region if momentum accelerates.


 English (US)