
 3 months ago
7539
3 months ago
7539

Key takeaways:
- Chainlink could reach a maximum value of $17.31 in 2025.
- By 2028, LINK could reach a maximum price of $56.92.
- In 2031, Chainlink will range between $140.07 and $62.84.
Chainlink (LINK) emerged as a prominent player in the cryptocurrency market. It provides a decentralized oracle network that connects smart contracts with real-world data, influencing the current price. As the adoption of decentralized finance (DeFi) and blockchain technology continues to grow, Chainlink’s innovative solutions have attracted significant attention from investors and developers alike.
Chainlink continues to expand its reach and utility across the blockchain ecosystem, showcasing its robust integration capabilities. Recent updates highlight 14 new integrations of 5 Chainlink services across 10 different blockchain platforms, demonstrating its versatility across multiple blockchains. , including prominent names like Arbitrum, Avalanche, and Ethereum. These integrations enhance Chainlink’s network and solidify its position as a critical player in decentralized applications’ interoperability and functionality.
Understanding Chainlink’s potential price movements involves analyzing various factors such as market trends, technological advancements, partnerships, and overall market sentiment. This Chainlink price prediction aims to provide insights into its future performance by examining technical analysis and fundamental aspects that could influence its value.
Overview
| Cryptocurrency | Chainlink |
| Token | LINK |
| Price | $18.28 (-5%) |
| Market Cap | $12.43B |
| Trading Volume (24-hour) | $598.6 Million |
| Circulating Supply | 678.09 Million LINK |
| All-time High | $52.88, May 09, 2021 |
| All-time Low | $0.1263, Sep 23, 2017 |
| 24-hour High | $18.45 |
| 24-hour Low | $17.46 |
Chainlink price prediction: Technical analysis
| Metric | Value |
| Price prediction | $19.48 (+5.86%) |
| Price Volatility (30-day variation) | 14.59% |
| 50-day SMA | $14.81 |
| 14-day RSI | 65 |
| Sentiment | Bullish |
| Fear & Greed Index | 70 (Greed) |
| Green days | 21/30 (70%) |
| 200-day SMA | $13.73 |
Chainlink price analysis: LINK drops below key support amid market pressure
- Rejection at $19.12 confirms strong resistance and triggered a sharp pullback.
- $17.91 support is holding but under pressure, raising breakdown risk.
- Bearish structure with lower highs suggests continued downside potential.
On July 29, 2025, Chainlink (LINK) is currently trading at $18.28, registering a 4.9% drop in the past 24 hours. The digital asset opened the day near $19.12, hitting a low of $17.91, showing clear signs of downward pressure. LINK has failed to hold on to its recent gains and now finds itself in a critical support zone, with near-term sentiment skewed to the downside. Market participants are closely watching the $17.91 support and $19.12 resistance levels for potential price reactions in the coming sessions.
Chainlink 1-day price chart: LINK forms a bearish channel below resistance
The daily chart shows LINK opened at $19.12 but faced immediate rejection, triggering a steady downtrend. A bearish engulfing candle formed as the price dropped to an intraday low of $17.91, now acting as key support.
 LINKUSDT Chart By TradingView
The RSI is above 50, signaling bearish momentum, while increased sell volume confirms strong downside pressure. LINK has dropped below its 20-day EMA, and price action is forming a descending channel, indicating continued weakness unless a breakout above $19.12 occurs.
Chainlink 4-hour price chart: LINK intraday rejections confirm short-term downtrend
The 4-hour chart shows a consistent lower-high structure, reinforcing the bearish setup. LINK failed to reclaim $18.50, confirming the short-term downtrend continuation.
 LINKUSDT Chart By TradingView
The support at $17.91 has so far held, but multiple rejections from $18.50–$18.70 reinforce heavy sell-side control. A break below $17.91 could trigger an accelerated decline into the $17.40–$17.20 range.
Chainlink technical indicators: levels and action
Daily simple moving average (SMA)
| Period | Value | Action |
| SMA 3 | $15.94 | BUY |
| SMA 5 | $17.62 | BUY |
| SMA 10 | $18.16 | BUY |
| SMA 21 | $16.48 | BUY |
| SMA 50 | $14.81 | BUY |
| SMA 100 | $14.93 | BUY |
| SMA 200 | $13.73 | BUY |
Daily exponential moving average (EMA)
| Period | Value | Action |
| EMA 3 | $16.17 | BUY |
| EMA 5 | $15.44 | BUY |
| EMA 10 | $14.72 | BUY |
| EMA 21 | $14.28 | BUY |
| EMA 50 | $14.88 | BUY |
| EMA 100 | $16.16 | BUY |
| EMA 200 | $16.55 | BUY |
What to expect from Chainlink?
Chainlink (LINK) remains in a vulnerable technical position as it trades near key support at $17.91, following a firm rejection from $19.12. The prevailing lower-high pattern on both the daily and 4-hour charts suggests that bearish momentum is in control, with no apparent signs of reversal yet.
If $17.91 support breaks, LINK could swiftly slide toward the $17.40–$17.20 range. On the other hand, any rebound would need to clear $18.50 and eventually $19.12 to challenge the bearish setup. Traders will be closely monitoring price action near these levels to gauge short-term direction.
Is Chainlink a good investment?
From a technical standpoint, Chainlink (LINK) is currently facing strong bearish momentum, with price action trading near a key support level of $17.91. The ongoing lower-high structure and failure to hold above resistance at $19.12 indicate weakness in the short term. Unless LINK reclaims critical levels, further downside remains a risk, making it less attractive for short-term traders.
However, from a broader perspective, Chainlink continues to maintain solid fundamentals. Its 4.2 market rating, active deployment on Ethereum, and integration with major wallets like MetaMask and Trust Wallet reflect ongoing ecosystem utility and developer confidence. Long-term investors may still view LINK as a viable asset within a diversified portfolio, especially for exposure to decentralized Oracle infrastructure. Still, timing entries around technical support and trend shifts will be key.
Why is the LINK price down today?
The 4.9% drop in Chainlink (LINK) on July 29, 2025, is primarily driven by technical rejection at the $19.12 resistance level, which triggered vigorous selling activity. After failing to sustain momentum above this zone, LINK slipped into a downtrend, hitting an intraday low of $17.91, a critical support level now under pressure.
The current price action reflects broader market weakness and a lack of bullish follow-through, with sellers dominating intraday moves. The formation of a bearish channel on the daily chart and consistent lower highs on the 4-hour chart confirm that traders are exiting positions near resistance. No major bullish catalyst or ecosystem update has emerged to offset the negative sentiment, adding to the short-term downside pressure.
Will Chainlink recover?
Chainlink’s price has declined recently, with minor short-term recoveries; however, the move is gradual. If buyers defend a drop below $15, we might see a strong recovery in the LINK price chart.
Will Chainlink reach $50?
Based on long-term forecasts, Chainlink (LINK) is projected to reach $50 by 2028, indicating potential future price movements as its ecosystem and user adoption continue to grow.
Will Chainlink reach $100?
Chainlink can reach $100 in the year 2030, per expert predictions.
Does Chainlink have a promising long-term future?
Chainlink shows some stabilization and potential for recovery, indicating the token may have a promising long-term future.
Chainlink price prediction July 2025
For July 2025, Chainlink is primed for notable growth. The minimum projected trading price is $12.55, with an average of around $13.87, relative to the current Chainlink price. LINK is expected to attain a peak price of $14.26.
| Chainlink Price Prediction | Potential Low | Average Price | Potential High |
| Chainlink Price Prediction July 2025 | $12.55 | $13.87 | $14.26 |
Chainlink (LINK) price prediction 2025
The market price for LINK is expected to reach a maximum of $17.31 in 2025. However, traders can expect a minimum trading price of $14.93, which is influenced by the overall market capitalization and an expected average trading price of $15.46.
| Chainlink Price Prediction | Potential Low | Average Price | Potential High |
| Chainlink Price Prediction 2025 | $14.93 | $15.46 | $17.31 |
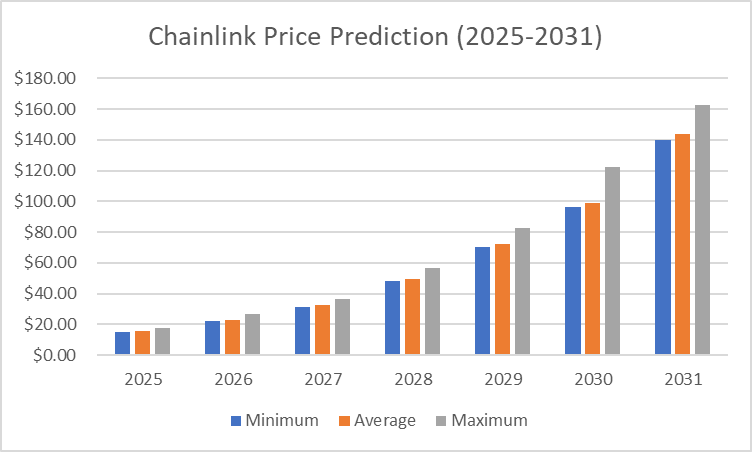
Chainlink price prediction 2026-2031
| Year | Minimum | Average | Maximum |
| 2026 | $21.84 | $22.46 | $26.54 |
| 2027 | $31.20 | $32.32 | $36.74 |
| 2028 | $48.00 | $49.30 | $56.92 |
| 2029 | $70.35 | $72.32 | $82.76 |
| 2030 | $96.23 | $99.13 | $122.11 |
| 2031 | $140.07 | $144.03 | $162.84 |
Chainlink price prediction 2026
In 2026, Chainlink is expected to reach a maximum value of $26.54, a minimum price of $21.84, and an average value of $22.46.
Chainlink price prediction 2027
In 2027, LINK’s average price is expected to be $32.32; its minimum and maximum trading prices, reflecting its historical performance, are predicted to be $31.20 and $36.74, respectively.
Chainlink price prediction 2028
The price of Chainlink is predicted to reach a minimum level of $48.00 in 2028. LINK can reach a maximum level of $56.92 and an average price of $49.30.
Chainlink price prediction 2029
The Chainlink price prediction for 2029 suggests a minimum price of $70.35, a maximum price of $82.76, and an average forecast price of $72.32, considering the total crypto market cap.
Chainlink price prediction 2030
In 2030, Chainlink prediction expects LINK to reach a maximum value of $122.11, a minimum price of $96.23, and an average value of $99.13.
Chainlink price prediction 2031
The price of Chainlink is predicted to reach a minimum value of $140.07in 2031. If the bulls hold, investors can anticipate a maximum cost of $162.84 and an average trading price of $144.03.
 Chainlink Price Predictions 2025-2031
Chainlink market price prediction: Analysts’ LINK price forecast
| Firm Name | 2025 | 2026 |
| DigitalCoinPrice | $28.91 | $33.70 |
| CoinCodex | $ 20.13 | $ 39.86 |
Cryptopolitan’s Chainlink price prediction
According to our Chainlink price forecast, the coin’s market price might reach a maximum value of $17.31 by the end of 2025. In 2026, the value of LINK could surge to a maximum cost of $26.54.
Chainlink’s historic price sentiment
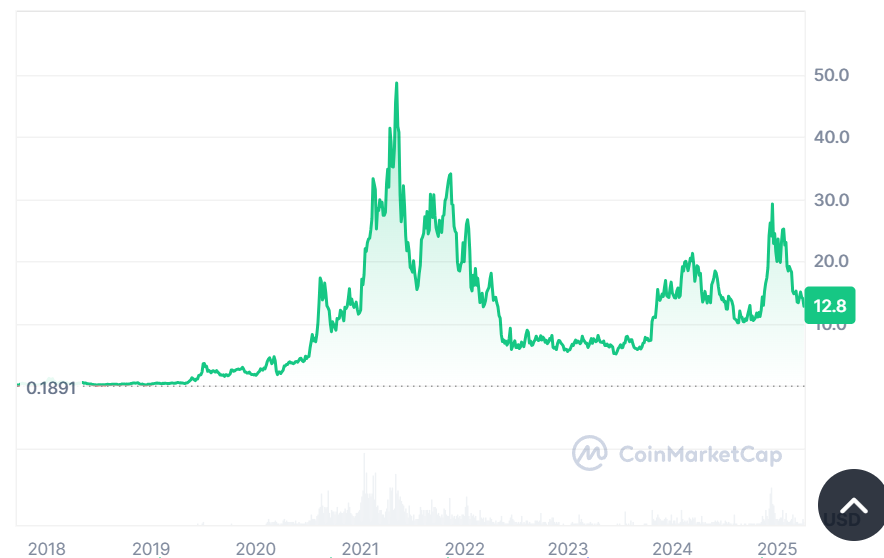
Chainlink price history: Coinmarketcap
- Chainlink launched at around $0.20 and remained under $1 throughout 2018, with moderate market cap growth. In 2019, LINK had substantial growth, reaching $1 in May and peaking around $3 by year-end, driven by its utility in providing reliable data feeds for smart contracts.
- 2020 marked a breakout year as LINK surged from $2 to $20 by August, fueled by DeFi demand. In 2021, it reached an all-time high of around $52 in May but dropped to $22 by mid-year due to market volatility.
- In 2022, LINK ranged between $15 and $25 amid broader market corrections. In 2023, it further declined, stabilizing in the $6 to $13 range as investor sentiment cooled.
- Starting 2024 at $15, LINK briefly spiked to $18 in February before falling to $12 by April. The coin’s price has fluctuated throughout 2024, peaking near $15 in May, dropping to around $10 by August, and stabilizing between $10 and $12.28 in October. In November, LINK is trading within the range of $10.68 to $11.94. In December, LINK maintained a range of $18.43 to $30.94.
- In January 2025, Chainlink peaked at $22.9 but lost momentum towards the end of the month, leading to a trading range of $19.20- $21.00 in February.
- In March 2025, Chainlink (LINK) experienced a strong upward trend, starting at approximately $13.73 and steadily rising to $16.02, with periods of volatility.
- In April, Chainlink (LINK) showed relatively stable price movement, fluctuating between $10.7 and $15.3, indicating volatility within a broad trading range.
- In May, Chainlink (LINK) started trading at approximately $14.20 and experienced some price swings, dipping below $13.90 at its lowest point. As of the latest data, the price has slightly recovered and is currently around $14.06, showing mild volatility.
- Chainlink (LINK) fluctuated between $11.5 and $15, experiencing a sharp mid-June dip but largely stabilizing around $13.1 by early July.


 English (US)