

A monthly chart of Dogecoin shows a brutal pattern of repeated rejections and cascading drops that looks grim at first glance.
Crypto analyst Trader Tardigrade laid out a decade-long structure in which the Dogecoin price has been hammered at critical resistance three separate times, triggering a massive plunge on each occasion. The 2026 rejection is now in place, and the analyst sees a third repeat of the same devastating sequence. However, the chart has a twist that changes everything.
Dogecoin Gets Hammered On An Inverted Monthly Chart
Trader Tardigrade’s chart shows DOGE/USD on the monthly timeframe, but the price scale is flipped. This means the lower the chart moves, the higher Dogecoin is moving in normal market price. The red descending line designated as a critical resistance is therefore not a bearish ceiling in the usual sense. It is a resistance line on an inverted chart, and a rejection from it sends the price downward.
As shown on the chart, Dogecoin couldn’t break through and got sent straight back down below the level. However, considering this is inverted, what it actually means is that Dogecoin is bouncing on a support trendline. A drop on the inverted scale would translate into a rally in DOGE’s real price.
The analyst pointed to three major moments when Dogecoin touched this inverted resistance and failed to break through. The first came around the 2017 cycle, the second around the 2021 cycle, and the third is being presented as the current 2026 setup. In each previous case, the rejection was followed by a large move downward on the inverted chart, which means a large rally upward on the normal Dogecoin chart.
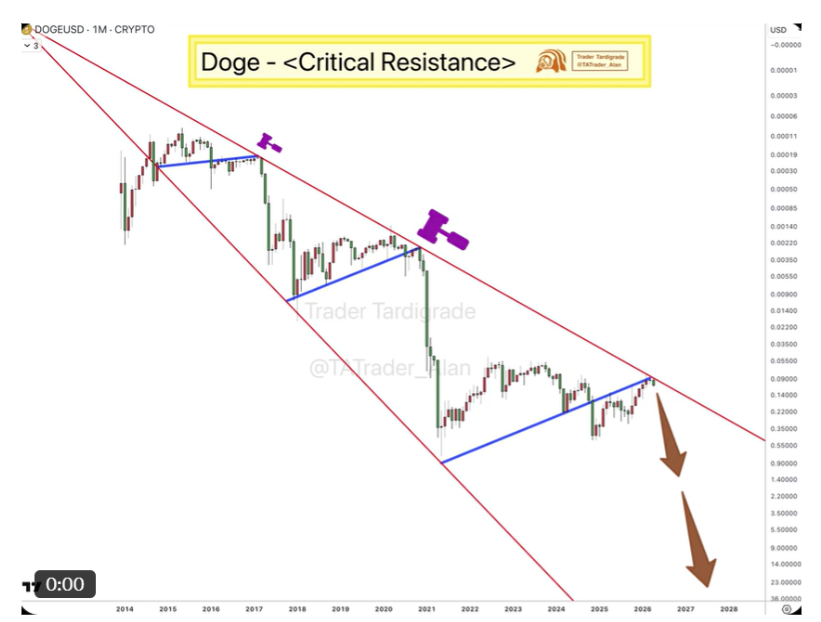
Dogecoin Price Chart. Source: @TATrader_Alan On X
What’s Next For Dogecoin?
“This drop is coming,” the analyst said. However, the drop being referenced is not a normal Dogecoin price crash. It is a drop on the inverted chart. In normal terms, that means the Dogecoin price would be rising. The chart’s projection even points to double-digit price levels if the historical drops on the inverted chart repeats itself.
That target is extreme compared to Dogecoin’s current price around $0.108. A move to $1 would require DOGE to rise by more than 825% from current levels, while a move to $10 would require a rally of more than 9,000%. However, the projection on the chart shows the Dogecoin price going to as high as $23. This is why the chart should be read as a long-term setup.
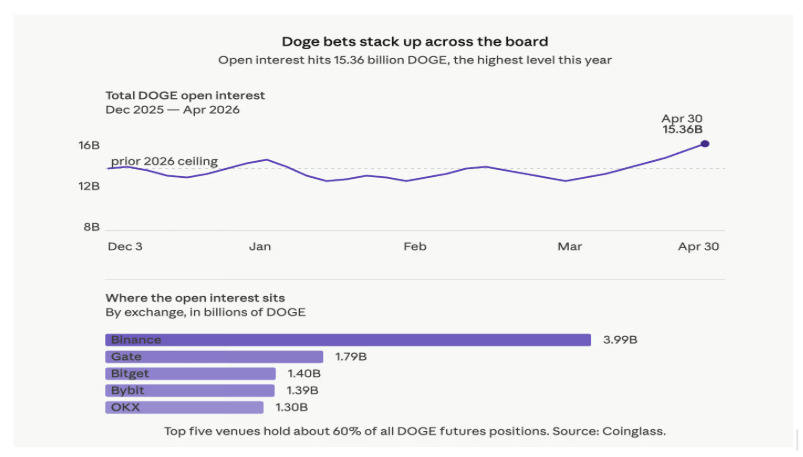
Speaking of price action, Dogecoin is actually showing signs of a bounce from support. DOGE reached as high as $0.11 in the past 24 hours, and it is currently up by about 10% in a seven-day timeframe. Interestingly, Dogecoin futures open interest is exploding and is now at its highest level of the year.
Featured image from Pexels, chart from TradingView


 English (US)