

Crypto analyst Ali Martinez has cautioned that XRP may be approaching another downswing after the Tom DeMark (TD) Sequential flashed a fresh sell signal on the daily timeframe. In a new video and transcript shared alongside a TradingView chart of the Binance XRP/USDT perpetual contract, Martinez said, “XRP could be bound for a correction. The TD Sequential Indicator on the daily chart has been remarkably accurate in calling XRP’s trend reversals over the past three months, and it has just flashed another sell signal.”
Is XRP Poised For A 16%+ Drawdown?
Martinez anchored the call in a sequence of recent TD prints that he argues lined up with notable reversals. “On July 22nd, a sell signal resulted in a 24% correction. On August 8th, a sell signal led to a 17% pullback. On August 23rd, a sell signal resulted in a 13% drop. On September 15th, another sell signal preceded a 13% dip. On September 27th, a buy signal resulted in a 12% rebound. On October 22nd, a buy signal led to a 14% surge. Now, the TD Sequential Indicator just flashed a sell signal, suggesting that a pullback may be underway.”
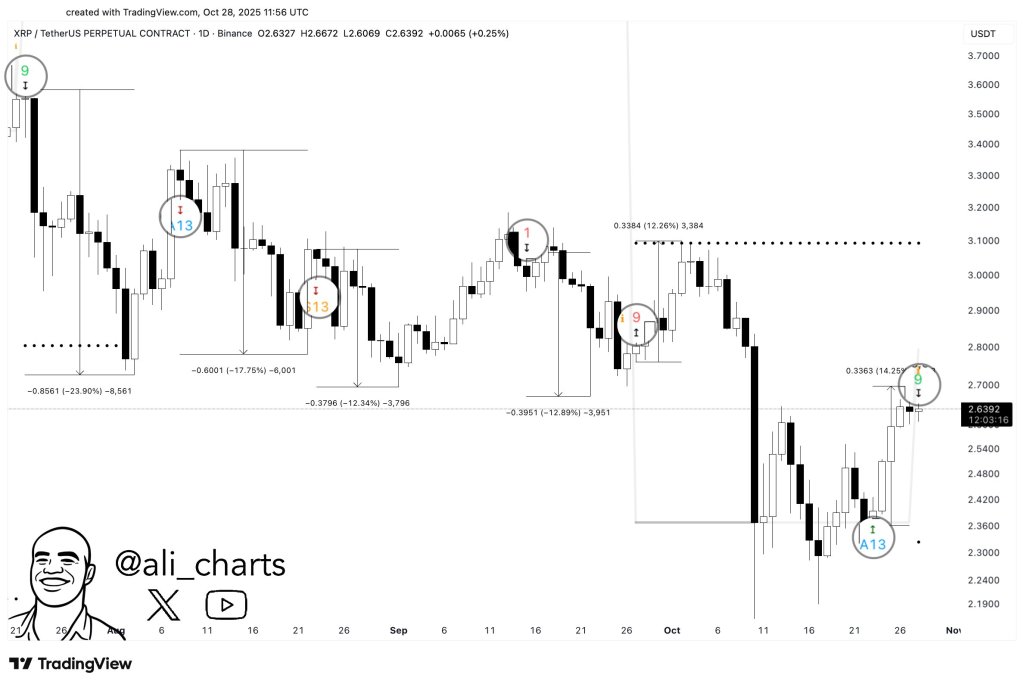
The above chart depicts the daily candles for the XRP/USDT perpetual on Binance with TD markers annotated at the cited swing points. It shows drawdowns and rebounds close to the magnitudes Martinez lists, with boxes highlighting approximate moves of about −23.9%, −17.75%, −12.34% and −12.89% following earlier sell counts, and rebounds of roughly +12.26% and +14.25% after the late-September and late-October buy signals.
The latest candle is labeled with a new “9” sell tag near the $2.64 area shown on the chart, underscoring the analyst’s warning that the next impulse could skew lower if the pattern persists.
TD Sequential signals are timing tools, not directional guarantees, and their effectiveness is typically judged ex-post by how consistently they appear near exhaustion points. Martinez’s argument is empirical and narrowly scoped to the recent three-month sample visible on his chart, where the recorded signals coincided with local peaks and troughs to a notable degree.
The present setup therefore pivots on whether XRP respects the latest sell print as it did in July, August, and mid-September, or whether the market breaks that cadence as it occasionally does in trending environments.
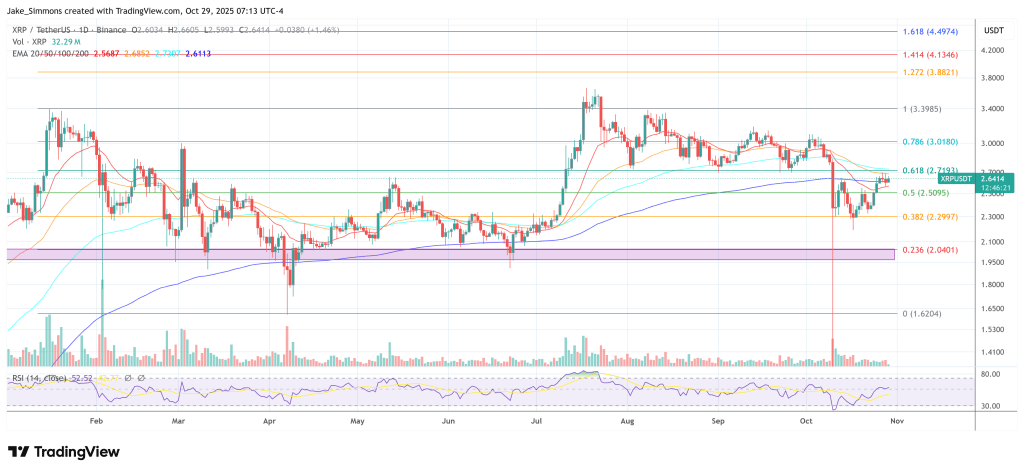
Martinez is not projecting targets or durations beyond the historical analogues he enumerates, and the only explicit inference he draws is that another corrective phase is statistically plausible given the recent behavior of the TD signals on the daily chart. Based on the four most recent TD sell signals (−24%, −17%, −13%, −13%), the average drawdown is ~16.75%, which—applied to the chart’s current price around $2.64—would imply potential downside toward roughly $2.20 if the pattern repeats.
At press time, XRP traded at $2.64.


 English (US)