
 2 months ago
13439
2 months ago
13439

Key takeaways:
- Pendle’s price is projected to reach a maximum of $3.31 by the end of 2026.
- By 2029, Pendle’s price is expected to reach an average of $9.31
- In 2032, the price of Pendle is predicted to reach a maximum of $8.35
Pendle (PENDLE) innovates the DeFi space by enabling future yield trading. This unique approach helps users maximize returns through advanced smart contracts and seamless integration with other DeFi platforms.
Pendle’s recent progress, such as smart contract updates and strategic partnerships, marks its growth and commitment to innovation. Will these developments increase the value of $PENDLE? Is Pendle worth investing in?
Let’s dive into the Pendle price prediction for 2026-2032.
Overview
| Token | Trading Volume (24-hour) |
| Price | $1.04 |
| Market Cap | $174.56M |
| Trading Volume (24 hour) | $48.35M |
| Circulating Supply | 281.52M PENDLE |
| All-time High | $7.52 (Apr 11, 2024) |
| All-time Low | $0.03349 (Nov 10, 2022) |
| 24-hour High | $1.08 |
| 24-hour Low | $0.98 |
Pendle price prediction: Technical analysis
| Metric | Value |
| Price Prediction | $ 1.07 (1.01%) |
| Volatility | 6.94% (High) |
| 50-day SMA | $ 1.25 |
| 14-Day RSI | 29.68 (Oversold) |
| Sentiment | Bearish |
| Fear & Greed Index | 13 (Extreme Fear) |
| Green Days | 11/30 (37%) |
| 200-Day SMA | $ 2.42 |
Pendle price analysis
TL;DR Breakdown:
- PENDLE collapsed 56% from $2.50 in January to current lows near $1.04, with both timeframes showing relentless lower highs and no meaningful recovery.
- Price is dangerously pressing the $1.00 psychological support — a breakdown opens $0.85–0.90, while reclaiming $1.20+ is needed to stabilize.
- Bears remain in control — high Bitcoin dominance, “Fear” sentiment, and no coin-specific catalyst keep PENDLE vulnerable to further downside.
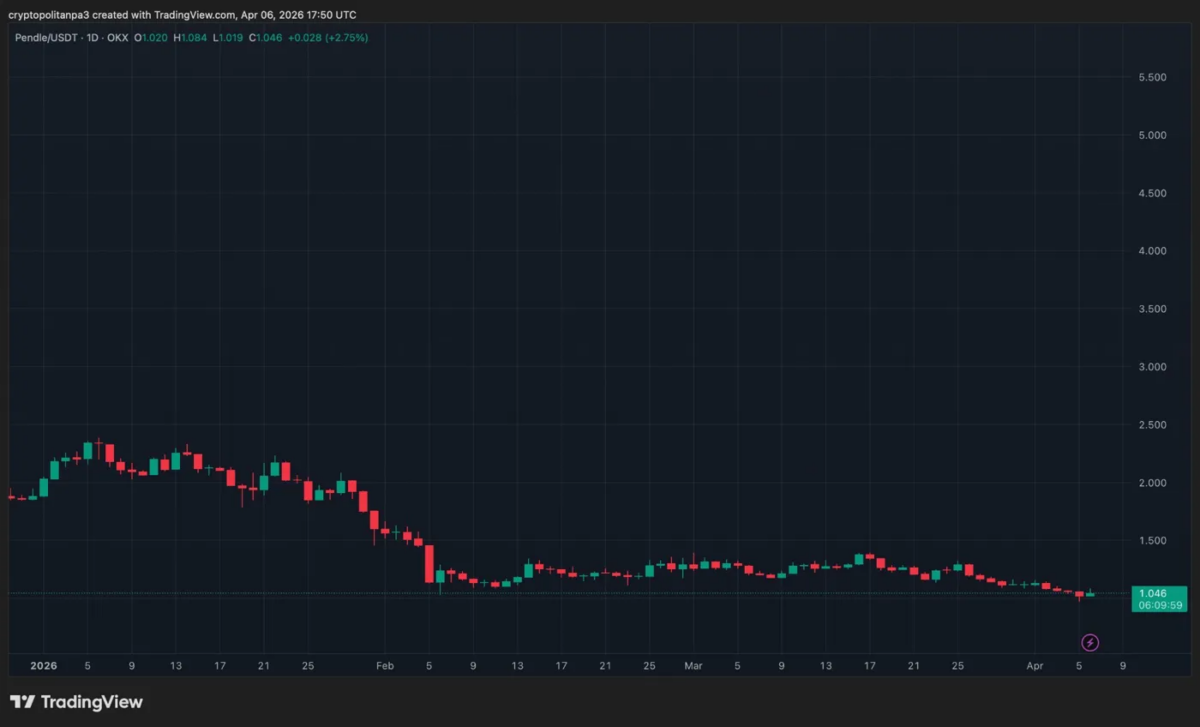
PENDLE/USD 1-day chart
 PENDLEUSD chartby TradingView
Pendle trades at $1.046, up 2.75%, but the daily chart (April 6) reveals a brutal downtrend since January 2026. Price collapsed from highs of $2.50 to a February low near $1.10 — a 56% decline — before stabilizing in a tight $1.10–$1.50 range throughout March. Recent price action shows another leg lower toward $1.00, testing a critical psychological support level. Today’s green candle is encouraging but isolated within a deeply bearish structure. Key resistance sits at $1.20–$1.30. A breakdown below $1.00 risks a drop toward $0.85. Bulls need to reclaim $1.30+ to stabilize. Structure remains firmly bearish.
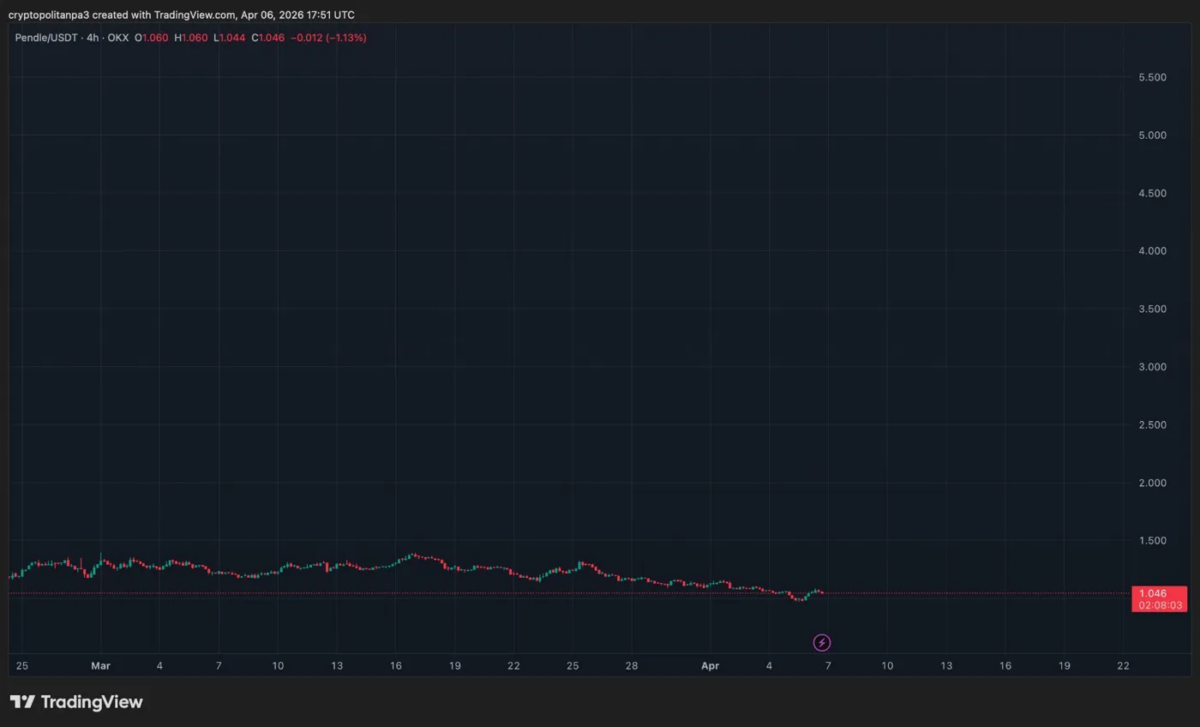
PENDLE/USD 4-hour chart
 PENDLEUSD chartby TradingView
Pendle trades at $1.046, down 1.13%, with the 4H chart showing a prolonged sideways grind since late February. Price has been compressing within an increasingly tight range of $1.10–$1.45 throughout March, with a slight downward drift toward $1.04 in early April — the lowest level in the visible timeframe. Candles are small and choppy with no clear directional momentum. The recent dip to $1.04 is testing critical support — a close below $1.00 would be deeply concerning. Resistance sits at $1.15–$1.20. Bulls need a decisive break above $1.20 to signal short-term recovery. Momentum is weakly bearish with exhaustion signals.
Pendle technical indicators: Levels and action
Daily simple moving average (SMA)
| Period | Value ($) | Action |
| SMA 3 | 1.49 | SELL |
| SMA 5 | 1.30 | SELL |
| SMA 10 | 1.15 | SELL |
| SMA 21 | 1.20 | SELL |
| SMA 50 | 1.25 | SELL |
| SMA 100 | 1.58 | SELL |
| SMA 200 | 2.42 | SELL |
Daily exponential moving average (EMA)
| Period | Value ($) | Action |
| EMA 3 | 1.19 | SELL |
| EMA 5 | 1.27 | SELL |
| EMA 10 | 1.46 | SELL |
| EMA 21 | 1.68 | SELL |
| EMA 50 | 2.02 | SELL |
| EMA 100 | 2.52 | SELL |
| EMA 200 | 3.08 | SELL |
What can you expect from PENDLE price analysis next?
PENDLE is at a critical juncture at $1.046, pressing against the psychological $1.00 support level after a devastating 56% decline from January highs. Two scenarios are likely — a hold above $1.00 could spark a relief bounce toward $1.20–$1.30, especially if broader market sentiment improves. However, a breakdown below $1.00 opens the door to $0.85–0.90 — uncharted recent territory. The 4H chart’s weeks-long sideways compression near lows suggests accumulation is possible, but without a strong catalyst or market-wide recovery, PENDLE risks another leg lower. Bulls must reclaim $1.20 convincingly to shift the narrative from bearish to neutral.
Is PENDLE a good investment?
Investing in Pendle coin offers a unique opportunity in the DeFi sector. Pendle’s approach to tokenizing and trading future yields allows for the flexible management of yield-bearing assets, enhancing investment portfolios. Conducting their research is crucial for potential investors to understand the Pendle market cap and the dynamics of its price movement.
Pendle’s ecosystem shows strong community trust, with impressive TVL, market cap growth, and endorsements from industry veterans like Arthur Hayes. These factors and high yields make Pendle a compelling investment in innovative DeFi projects.
Why is Pendle down today?
PENDLE is down today due to a combination of technical and macro pressures. The RSI sits at 34.15 near oversold, MACD shows a bearish signal with a negative histogram, and price remains below the EMA20 at $1.16 — with the Supertrend indicator firmly bearish and $1.0672 acting as immediate resistance. The broader market is in “Fear” territory with Bitcoin dominance at 58.39%, meaning capital is not rotating into altcoins like PENDLE — leaving it vulnerable to broader market downdrafts with no coin-specific catalyst to reverse the trend
Will Pendle reach $50?
The current Pendle price is around $1.28. Given its recent market trend, predictions suggest that by 2032, Pendle’s maximum price will not surpass the $50 mark.
Will Pendle reach $100?
Pendle price is likely to reach $100 in the foreseeable future.
Is Pendle a safe investment?
Pendle cryptocurrency offers innovative yield management features, making it appealing for investors. However, it carries risks like market volatility and potential technological issues. Investors should conduct thorough research and consider their risk tolerance before investing in Pendle.
Does Pendle have a good long-term future?
PENDLE has shown volatility and recent downward movement. Its short-term outlook appears uncertain. However, its long-term future could be positive if the project innovates, gains wider adoption, and maintains strong community and developer support.
Recent news/opinion on Pendle
Pendle announced the launch of its new Algorithmic Incentive Model that cuts token emissions by about 30%, introduces boosted co-incentives and limited-time rewards, expands cross-chain yield opportunities, and unveils upcoming HYPE markets alongside new integrations such as Ethena PTs on Aave and metals-backed assets on Boros.
Pendle price prediction April 2026
In 2026, the Pendle price is forecast to reach a low of $0.9845. It could get a maximum of $1.48, with the average expected price around $1.20.
| Pendle price prediction April 2026 | $0.9845 | $1.20 | $ 1.48 |
Pendle price prediction 2026
Pendle’s 2026 forecast of $2.57–$3.31, with an average closing price of $2.99, is driven by its growing role in yield tokenization, allowing users to trade future yield streams. Rising DeFi adoption, strong TVL growth, and integrations with major Ethereum Layer-2s strengthen demand. Market-wide consolidation, however, limits extreme volatility, keeping Pendle within this range.
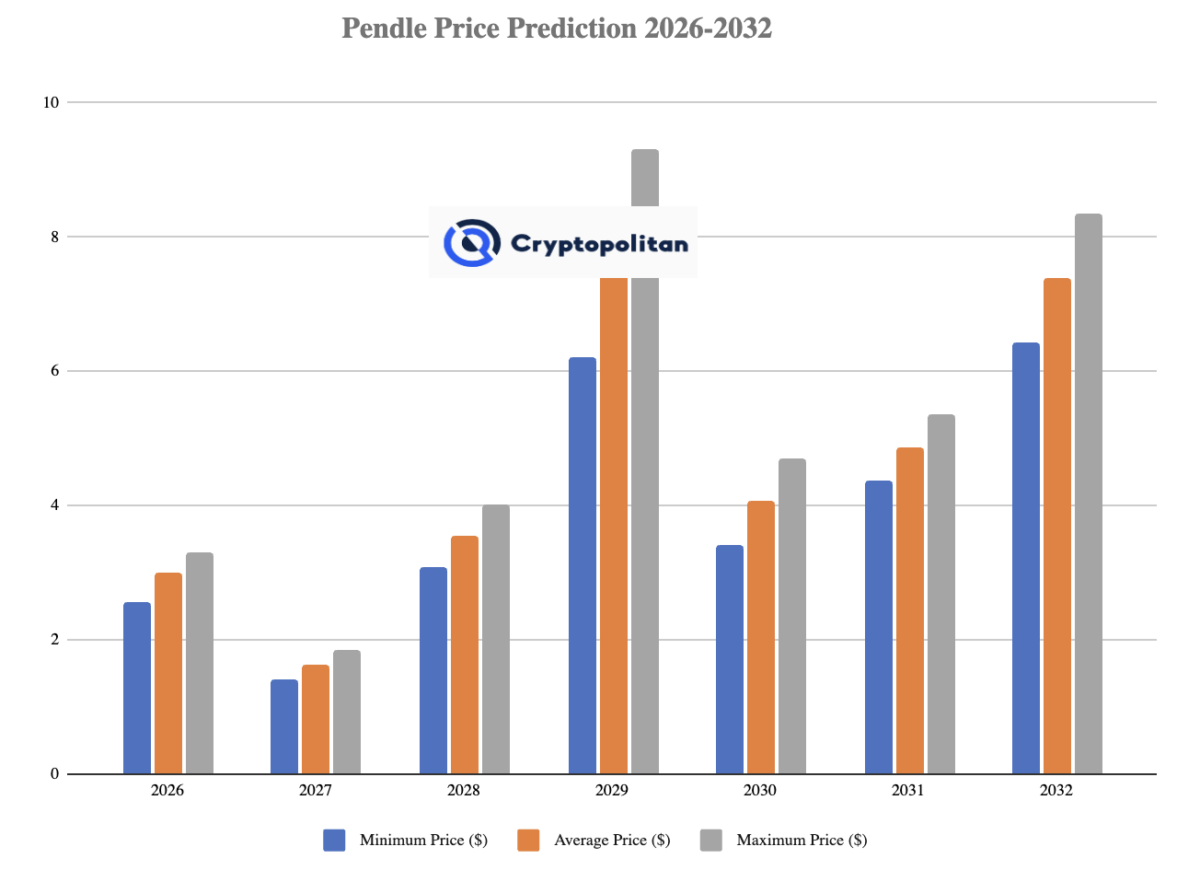
| Pendle Price Prediction 2026 | $2.57 | $2.99 | $3.31 |
Pendle price prediction 2027-2032
| 2027 | $1.40 | $1.62 | $1.85 |
| 2028 | $3.09 | $3.55 | $4.01 |
| 2029 | $6.21 | $7.76 | $9.31 |
| 2030 | $3.41 | $4.06 | $4.71 |
| 2031 | $4.37 | $4.86 | $5.35 |
| 2032 | $6.43 | $7.39 | $8.35 |
Pendle Price Prediction 2027
In 2027, the price of Pendle is predicted to reach a minimum level of $1.40. It can also reach a maximum level of $1.85 and an average trading price target of $1.62. This is expected due to an expanding adoption of yield tokenization as institutional players and DeFi protocols increasingly integrate fixed-yield products. Higher TVL, cross-chain growth, and broader Ethereum scaling solutions are expected to boost utility. At the same time, market corrections may cap extreme gains, keeping prices within range.
Pendle price prediction 2028
Pendle’s 2028 forecast of $3.09–$4.01, averaging $3.55, is fueled by growing TVL, stronger cross-chain integrations, and institutional interest in fixed-yield products. Demand should rise steadily.
Pendle price prediction 2029
The PENDLE price prediction for 2029 projects a minimum price of $6.21 for the token. According to the analyst forecast, the token could reach a maximum price of $9.31 and an average trading price of $7.76.
Pendle price prediction 2030
The price of Pendle is predicted to decline from previous years and reach a minimum value of $3.41 in 2030. Per the predictions, holders can expect a maximum price of $4.71 and an average trading price of $4.06.
Pendle price prediction 2031
The Pendle price forecast for 2031 projects has a minimum price of $4.37, a maximum price of $5.35 and an average forecast price of $4.86.
Pendle price prediction 2032
Pendle’s price is expected to reach a maximum price of $8.35, with a minimum price of $6.43 by 2032. The average trading price is expected to be $7.39.
 Pendle price prediction 2026-2032
Pendle market price prediction: Analysts’ $PENDLE price forecast
| DigitalCoinPrice | $1.56 | $2.34 |
| Coincodex | $ 1.31 | $2.58 |
Cryptopolitan’s PENDLE price prediction
In 2026, Cryptopolitan projects that $PENDLE could experience notable price fluctuations, with a potential low of $1.50, and a possible high of $2.00.
Pendle historic price sentiment
 PENDLE price history by Coingecko
- Pendle traded below $1 from its 2020 launch until late 2023, when it rose to around $1.20
- In 2024, the token rallied strongly to $7.52 in April before correcting and closing the year at $5.07
- Early 2025 saw a sharp decline below $2 amid US-China tensions before recovering above $3 by April
- Between July and August 2025, Pendle fluctuated between $3.74 and $6.00, showing both volatility and resilience
- Since early September, Pendle has stabilized between $4.70 and $5.30 with steady demand driven by DeFi and yield tokenization growth
- In early November, the price ranged around $2.70–$3.05, dipping mid-month toward the $2.10–$2.30 range as the token retraced.
- By late November to early December, Pendle recovered modestly, climbing back into the $2.60–$2.75 zone — around $2.64 on Dec 3 — suggesting the token stabilized after mid-month weakness.
- From December 2, 2025, Pendle moved down from around $2.64 to the low $1.70s by mid-December, reflecting a steady decline as the price slipped through support levels and volatility increased.
- Into late December and early January, Pendle rebounded from roughly $1.71 to the high $1.80s by Dec 31, then continued higher into 2026, closing near $2.19 on Jan 2 and ~ $2.17 on Jan 3 as momentum improved.
- From January 3 to mid-January 2026, Pendle climbed from the low-$4 range into the mid-$5 area, driven by strong momentum after a breakout above short-term resistance and rising trading volume.
- From late January through February 7, 2026, price action cooled as Pendle pulled back toward the high-$4 to low-$5 zone, with sellers defending overhead levels while buyers stepped in repeatedly near support to prevent a deeper decline.
- From February 7 to mid-March 2026, BRETT grinded steadily lower from around $0.0080–0.0085 — breaking through multiple support levels with brief relief bounces failing to hold — eventually hitting a low near $0.0062 by late March as broad crypto selling and “Extreme Fear” sentiment crushed memecoin demand.
- From late March into April 6, BRETT attempted a fragile stabilization between $0.0062–0.0070, trading in an increasingly compressed range with microscopic candles — closing April 6 at $0.00635, representing a total decline of roughly 25% over the period with no meaningful recovery catalyst emerging.


 English (US)