

Veteran trader Peter Brandt is sketching out a highly conditional long-term path for Bitcoin that points to a potential peak between $300,000 and $500,000 in late 2029, even as he argues the market still has not produced the kind of action that typically marks a durable bottom.
In a post on X, Brandt wrote: “Should Bitcoin continue with the most remarkable cyclic patterns of any market in the past 15 years, an investable low is scheduled for Sep/Oct 2026. That low might or might not penetrate the Feb 2026 low. The next high (should patterns continue) will be between $300k and $500k in Sep/Oct 2029.”
Thus, Brandt the target to a single condition: that Bitcoin continues to respect the cyclical behavior he says has defined the asset over roughly the last decade and a half. That leaves the near-term setup doing a lot of work. Before any 2029 blow-off scenario comes into view, Brandt is signaling that the current structure still looks incomplete.
Why Brandt Is Not Calling A Bitcoin Bottom Yet
That skepticism came through more clearly in his reaction to a chart posted by JDK Analysis. Brandt’s reply was blunt: “This does not look like a bottom.”
JDK’s chart argued that the recent advance has the character of a “Short Re-Accumulation,” but only in a probabilistic sense. The analyst wrote, “As long as bulls fail to show clear strength and follow-through, the current low does not qualify as a strong bottom. This is purely a probabilistic view!”
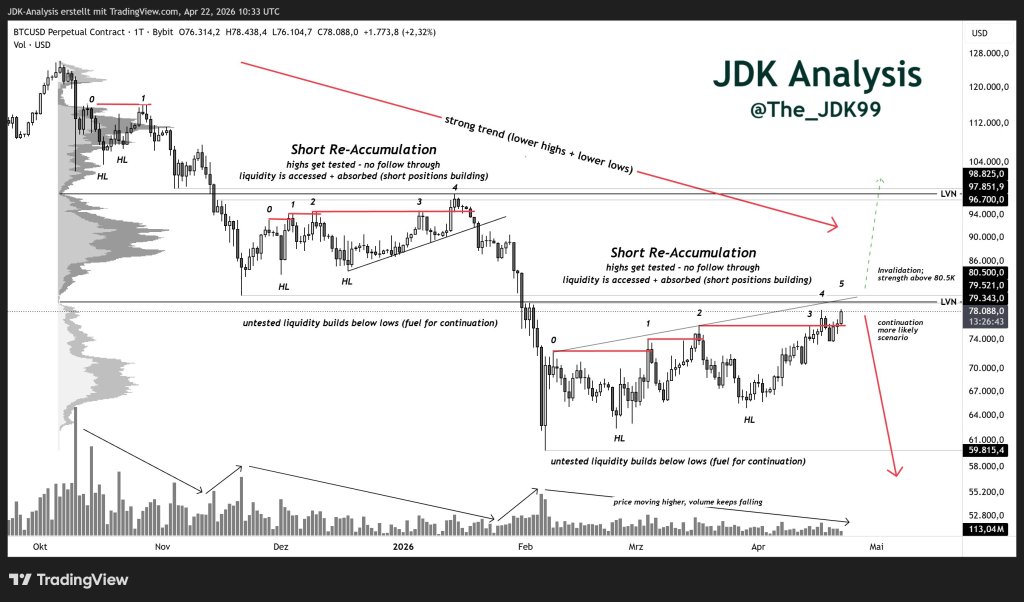
The setup highlighted repeated tests of local highs, fading volume as price pushed higher, and an invalidation level above roughly $80.5K, while suggesting continuation lower remained the more likely path if buyers failed to force a clean break.
Brandt also amplified renowned chartist Aksel Kibar, calling him “the most accomplished pure classical chart analyst alive today.” Kibar’s read on the market was less about prediction than process, but the message was similar: technical structures are provisional until price confirms them.
“Sometimes I get criticized by followers who have a position and want to see updates confirming that position on ‘adjusting’ the boundaries,” Kibar wrote. “Well, as the market offers new information we need to adjust. We can’t be dogmatic about our analysis. What looks like a wedge, can morph into a channel. What looks like a bearish continuation can break above the channel boundary requiring action.”
That comment was attached to a BTC chart showing exactly that kind of morphing structure. What had previously looked like a rising wedge was reinterpreted as a more clearly defined channel, with several rejections at the upper boundary.
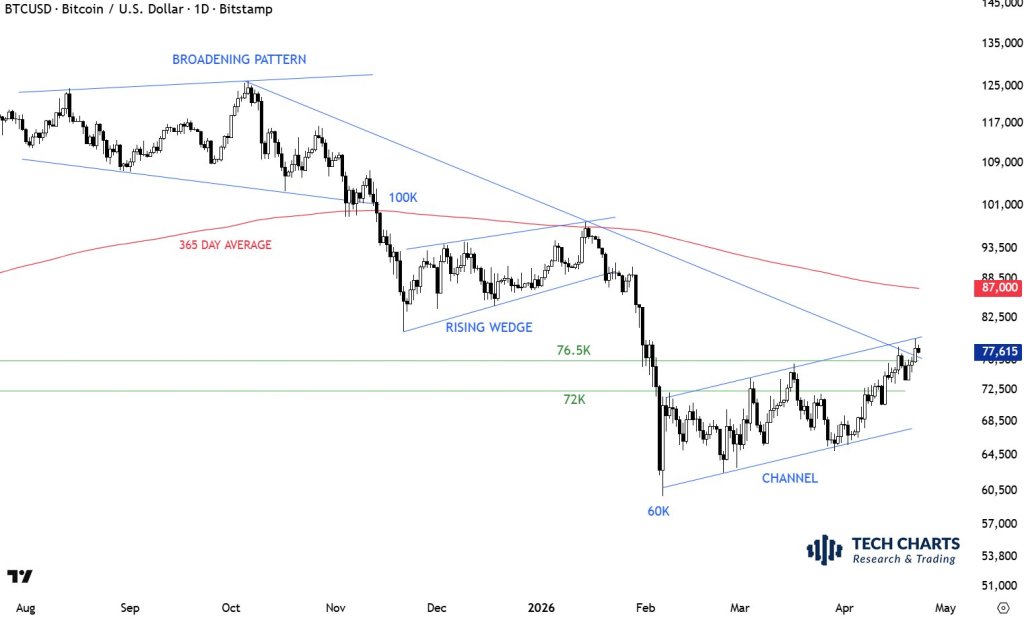
The chart also shows Bitcoin still trading below an ascending resistance line and below the 365-day average near $87,000, with the late-February washout toward $60,000 followed by a rebound into the upper-$70,000 area. Nearby levels around $76,500, $72,000 and the low-$80,000s appeared central to the current battle.
At press time, BTC traded at $78,196.


![KOSPI Index Crash, South Korea Stock Market Bloodbath [LIVE] – 8th June](https://image.coinpedia.org/wp-content/uploads/2026/03/03183804/Korean-Stock-Market-Crash-KOSPI-Plunges-7-Amid-U.S.%E2%80%93Israel-Iran-War-1-1024x536.webp)


 English (US)