
 3 months ago
9551
3 months ago
9551

The post Solana Price Analysis: Is SOL Setting Up for a Bullish Correction or Another Leg Lower? appeared first on Coinpedia Fintech News
Solana is trading at a critical turning point after an extended downtrend. Following a sharp sell-off from the November highs, SOL has spent the last several weeks consolidating above the $118–$120 zone. This area has now been defended multiple times, shifting focus to whether the current structure can support a bullish correction or if the SOL price is merely pausing before a continuation lower.
SOL Price Structure: Compression Below Key Resistance
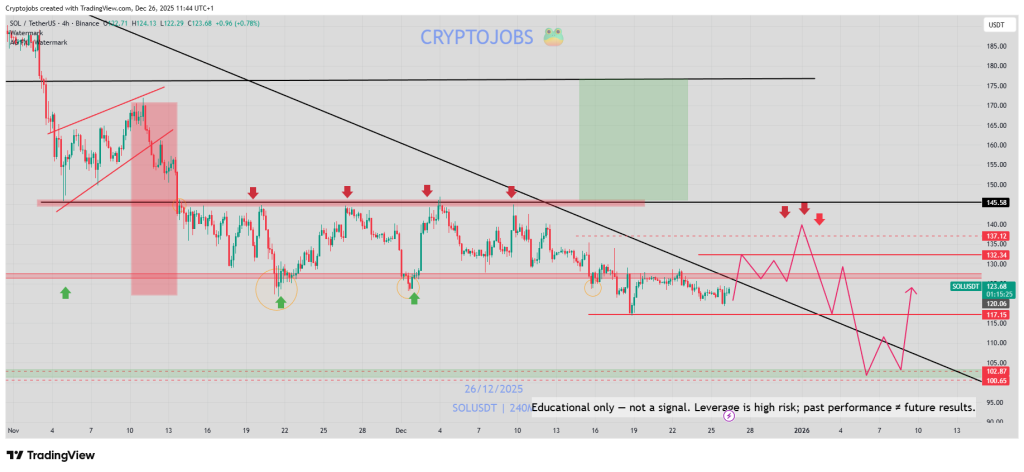
On the 4-hour chart, Solana continues to trade below a descending trendline, keeping the broader structure bearish. However, price action has compressed into a tightening range, forming a reversal wedge pattern. This signals a reduction in downside momentum, even though sellers still control the trend.
 Source: X
Importantly, each dip toward the $118–$120 region has been met with responsive buying. While this does not confirm a reversal, it shows that downside follow-through is weakening—a necessary condition for any corrective bounce to develop.
Momentum Signals Are Improving, but the Trend Is Not Reversed
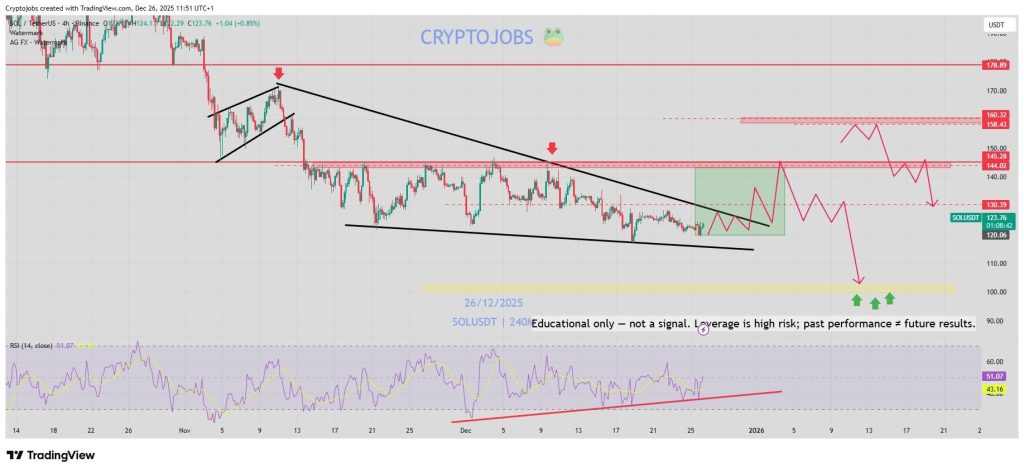
Momentum indicators are starting to diverge from price. On the 4-hour timeframe, RSI is printing a bullish divergence, suggesting selling pressure is fading despite price remaining capped. On the daily chart, a double-bottom-like structure is forming, adding to the base-building narrative.
That said, these are early signals, not confirmation. Until Solana reclaims key resistance zones, the move should be treated as a counter-trend correction, not the start of a new uptrend.
Key Levels That Will Decide the Next Move
Traders should stay focused on clean, well-defined levels:
- Major support: $118–$120
- Near-term resistance: $132–$136
- Heavy supply zone: $145–$158 → $160
- Invalidation: Sustained break below $118
- Bearish continuation target: $105 → $100
As long as SOL trades below $145–$160, sellers retain higher-timeframe control. Any rally into this zone should be evaluated carefully for acceptance or rejection.
What Needs to Happen for a Bullish Correction
For a meaningful corrective rally to play out, Solana needs:
- A break and acceptance above the descending trendline
- Sustained trading above $132 with volume expansion
- Momentum is holding firm above the RSI midline
Without these confirmations, upside moves risk becoming lower-high setups rather than structural reversals.
What the Solana Chart Is Signaling Right Now
Solana (SOL) price is showing conditions for a bounce, but not confirmation of a trend shift. The $118–$120 support remains the key line in the sand. Holding it keeps the door open for a corrective move toward $145–$160, while failure would likely reopen the path toward $100.
For traders, this is a reaction zone, not a conviction long. Let price prove strength before assuming the worst is over.


 English (US)