The post Sui Price Analysis: Can Bulls Hold $2.00 as Bearish Momentum Falls? appeared first on Coinpedia Fintech News
Recent Sui price action tells a gripping story of resilience, sharp reversal, and caution. In the last 24 hours, SUI jumped 0.56% to $2.02 after plunging over 14% in the past week. The market cap nudged higher to $7.42 billion, with volume jumping 2.5% to $1.05 billion. This choppy stretch started with a pattern formation at $1.952. Followed by a relief rally as algorithmic triggers and large traders swooped in near the major $1.93 support band.
The backdrop includes a key network milestone, the Mysticeti v2 upgrade, which gave speed and scalability a much-needed push. While this gave bullish traders hope, most SUI price moves still reflected a technical battle, not just raw fundamentals. Institutional shuffling at the $2.00 level hinted at larger players adjusting positions but didn’t tilt price action decisively.
Sui Price Analysis
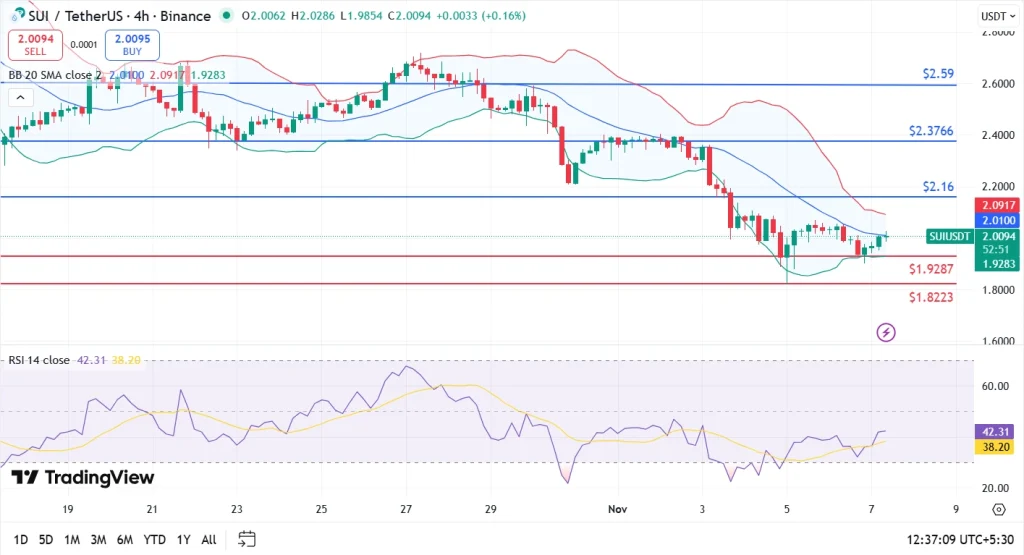
The 4-hour SUI/USDT chart shows that sellers had control for most of the week. The rebound from the $1.95 double-bottom on November 6 was dramatic, triggered by the RSI hitting an insanely oversold reading of 23.27. This deep dip attracted bargain hunters and likely sparked algorithmic buy programs and short-covering right above support.

Despite the bounce, SUI price remains below every major moving average. The 7-day SMA at $2.16 and the 200-day exponential at $3.19 are both overhead. The MACD momentum indicator reveals that selling pressure is fading, but bulls still need a firm close above the $2.05 area. November 6’s high, to shatter the pattern of lower highs and injected new optimism.
Digging deep into technicals, the Bollinger Bands show price hugging the lower band before springing back. This is typical when sellers are depleted and a relief rally takes hold. The RSI climbing from 23.27 (deeply oversold) to above 42 shows buyers stepping in, yet a reading below 50 means caution still prevails.
Short-term support sits at $1.93, with deeper risk toward $1.82 if markets turn. On the upside, resistance at $2.05 and then $2.16 is key. Price must push and hold above these for a true trend shift. Otherwise, rallies risk being faded by sellers with each touch of overhead resistance.
FAQs
A sustained move above $2.05 and follow-through over $2.16 would suggest a bullish reversal, breaking the streak of lower highs.
Yes, the recent RSI plunge below 24 flagged a deeply oversold condition, which helped spark the current rebound, but the indicator remains below the neutral 50 level.
Key support sits at $1.93, the zone where buyers responded forcefully and ignited the latest bounce. A break below risks another leg down toward $1.82.

 3 hours ago
491


 English (US)