

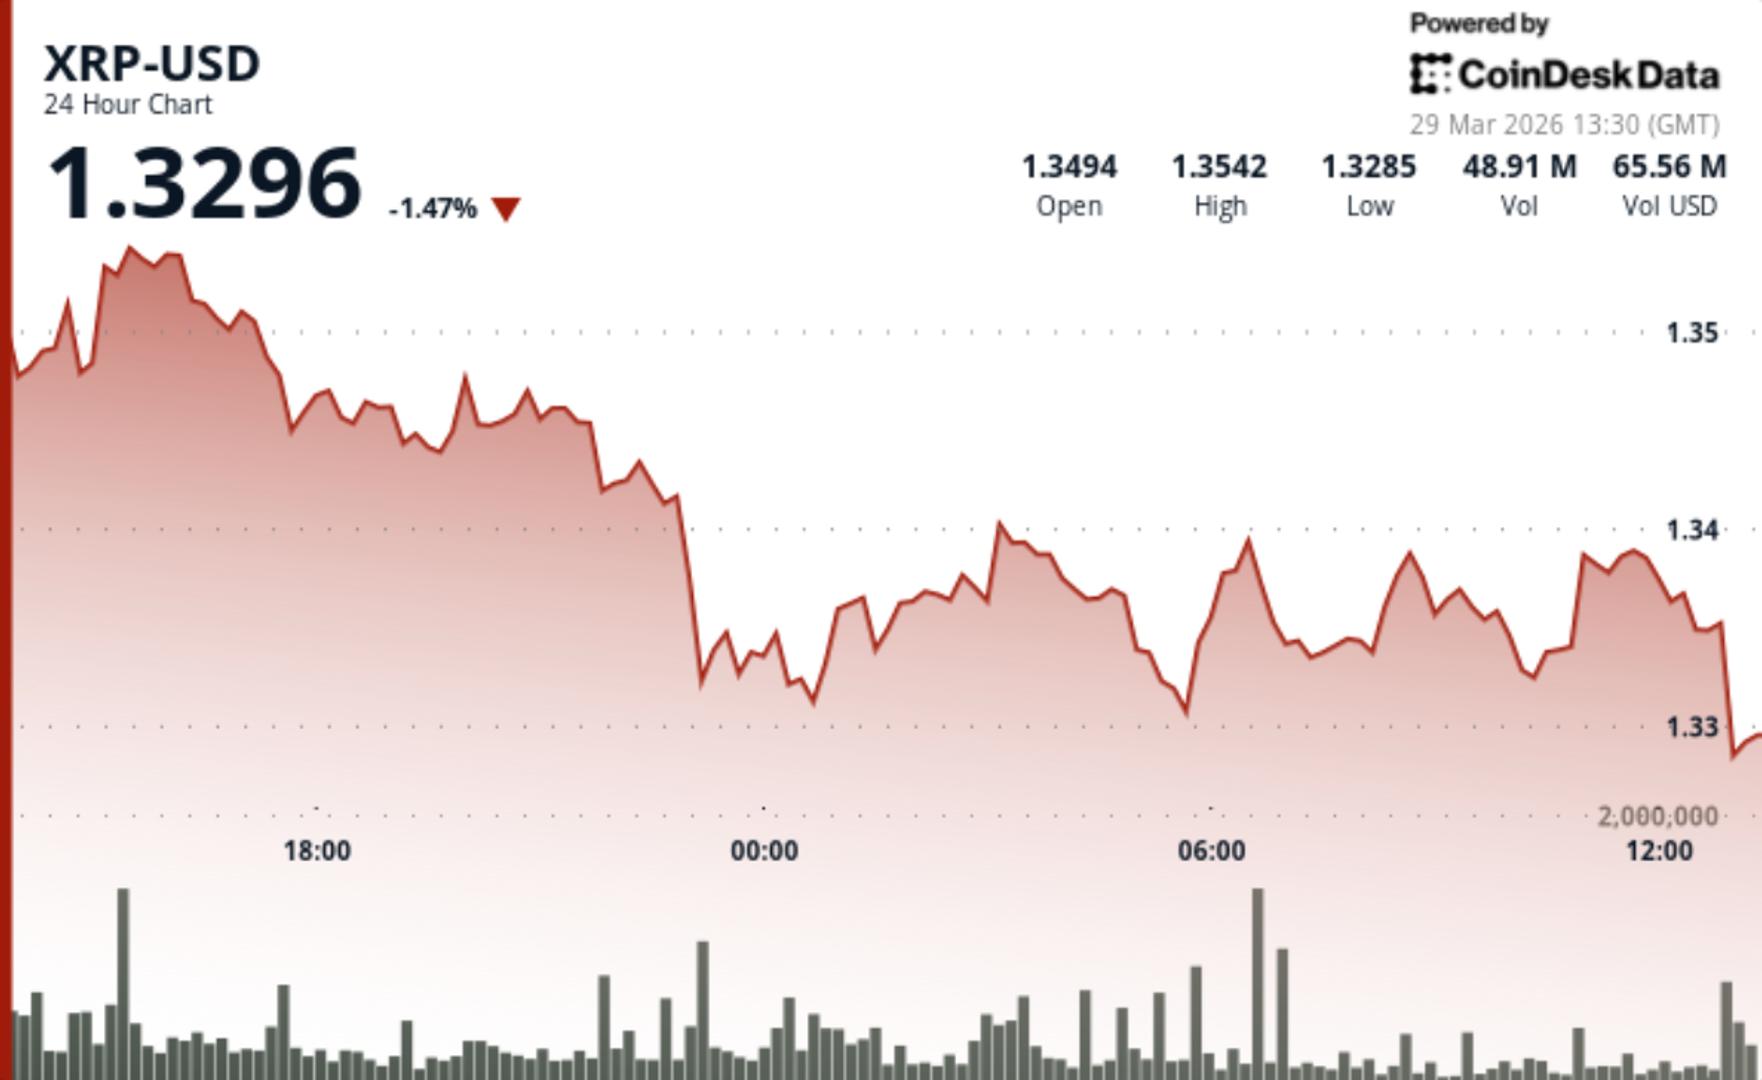
The XRP price structure is not giving a clear bullish signal, and there are questions as to whether the current range will hold up and whether there’s going to be another leg down.
Crypto analyst Hov, who has been tracking XRP’s structure on the weekly timeframe, laid out a detailed Elliott Wave count on X that identifies exactly where the price stands and what it needs to do in the coming sessions to avoid a more serious breakdown.
XRP Wave Structure Is Sending A Warning Signal
Crypto analyst Hov pointed out that the XRP price action coming off the recent lows lacks the kind of impulsive strength traders look for when a reversal is going on.
Hov’s chart, drawn on the weekly timeframe, traces out an expansive Elliott Wave sequence beginning from XRP’s 2018 cycle top through the corrective lows of 2019/2020, recovering across the 2021 bull cycle, and extending into the current setup.

What the analyst observed is interesting: the XRP price action from the recent swing low is printing a series of threes, not a clean five-wave impulsive structure. In Elliott Wave theory, a sequence of three-wave moves is corrective by nature. It implies that the dominant trend may not have fully reversed and that price could still be responding to a larger downward cycle.
The expectation earlier was that XRP would push into a fifth wave off the lows to confirm bullish intent. That move has not materialized. As long as the price structure is corrective, then there are risks of continuation to the downside.
Major Price Levels To Watch
As it stands, XRP has spent the past few days trading in a range between $1.30 and $1.35. This zone has acted as a pivot in recent price action, and losing it could lead to a deeper move lower. Hov specifically warned that a higher timeframe below this support would increase the likelihood of a breakdown.
The 12-hour chart also shows a deeper support region closer to the $1.15 range, which is based on the 0.5 Fibonacci retracement level. If the current level fails, that area becomes the next logical target.
There is still room for the bullish scenario to play out, but the window is narrowing. “That doesn’t mean we can’t recover it just means we gotta do it quickly because we are just barely holding our key level on HTF,” Hov said.
That important higher-timeframe level is visible in the chart as the lower boundary of a wide cyan support zone between $1.45 and $1.70. The bullish scenario will play out as long as the XRP price holds above the sub-wave 1 high from mid-2023, which is around $0.88.
The first and more immediately bullish scenario requires XRP to reclaim the white box at $1.50 and achieve a higher-timeframe close above it. A sustained close above this zone would set off the price action to $1.80.


 English (US)