

XRP price started a downside correction below the $1.3420 zone. The price is now showing bearish signs and might decline further below $1.3150.
- XRP price started a downside correction after it failed to stay above the $1.3450 zone.
- The price is now trading above $1.3150 and the 100-hourly Simple Moving Average.
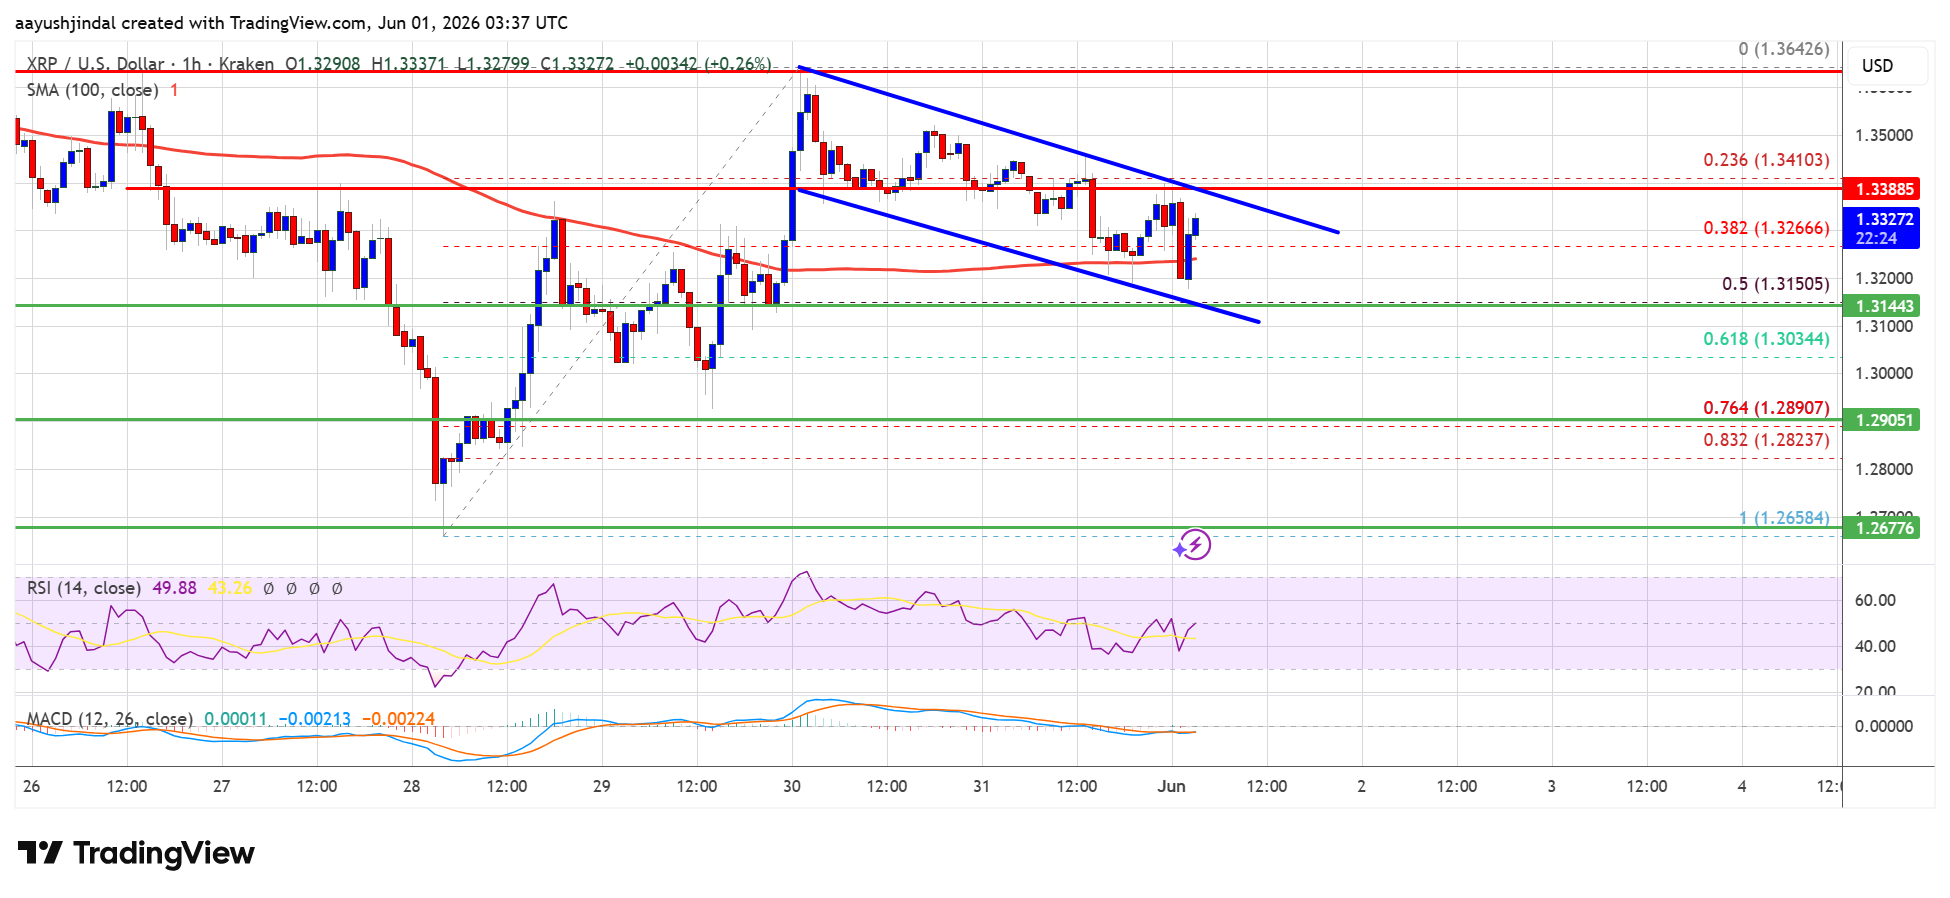
- There is a declining channel forming with resistance at $1.3380 on the hourly chart of the XRP/USD pair (data source from Kraken).
- The pair could continue to move down if it stays below $1.3420.
XRP Price Dips Below Support
XRP price struggled to stay above $1.3520 and started a fresh decline, like Bitcoin and Ethereum. The price dipped below the $1.350 and $1.3450 levels.
The price declined below $1.3420. There was a clear move below the 38.2% Fib retracement level of the upward move from the $1.2658 swing low to the $1.3642 high. Besides, there is a declining channel forming with resistance at $1.3380 on the hourly chart of the XRP/USD pair.
The price is now trading above $1.3150 and the 100-hourly Simple Moving Average. If there is a fresh upward move, the price might face resistance near the $1.3380 level. The first major resistance is near the $1.3420 level, above which the price could rise and test $1.350.
A clear move above the $1.350 resistance might send the price toward the $1.3580 resistance and the trend line. Any more gains might send the price toward the $1.3650 resistance. The next major hurdle for the bulls might be near $1.3740.
More Downside?
If XRP fails to clear the $1.3380 resistance zone, it could start a fresh decline. Initial support on the downside is near the $1.320 level. The next major support is near the $1.3150 level and the 50% Fib retracement level of the upward move from the $1.2658 swing low to the $1.3642 high.
If there is a downside break and a close below the $1.3150 level, the price might continue to decline toward $1.3120. The next major support sits near the $1.3050 zone, below which the price could continue lower toward $1.2920. Any more losses might call for a test of $1.2880.
Technical Indicators
Hourly MACD – The MACD for XRP/USD is now gaining pace in the bearish zone.
Hourly RSI (Relative Strength Index) – The RSI for XRP/USD is now below the 50 level.
Major Support Levels – $1.3200 and $1.3150.
Major Resistance Levels – $1.3380 and $1.3500.


![KOSPI Index Crash, South Korea Stock Market Bloodbath [LIVE] – 8th June](https://image.coinpedia.org/wp-content/uploads/2026/03/03183804/Korean-Stock-Market-Crash-KOSPI-Plunges-7-Amid-U.S.%E2%80%93Israel-Iran-War-1-1024x536.webp)


 English (US)