
 1 hour ago
378
1 hour ago
378

After more than 10 consecutive months in a bear market, Bitcoin (BTC) has seen its active addresses plunge to the same level seen during the 2018/2019 crypto bear market.
The Bitcoin Active Addresses, which tracks unique BTC addresses that have sent and received this asset each day, was at 545,233 on August 9, 2026, according to data from CryptoQuant, analyzed by Finbold on August 10.
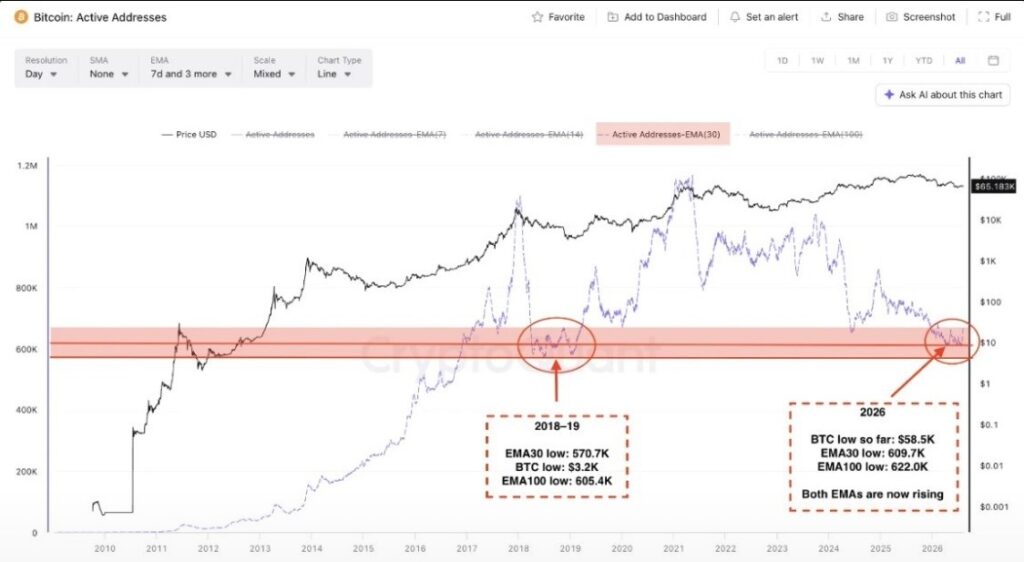 BTC active addresses all-time chart. Source: CryptoQuant
In July 2018, the number of these addresses – the 30-day EMA ( Exponential Moving Average)- on the Bitcoin network was at 570,710. By January 2019, Bitcoin’s active addresses (100-day EMA) were at 605,433.
On October 6, when BTC price traded at $124,709, the number of unique active addresses (SMA 30 on the network was at around 721,755. As Bitcoin’s active addresses (SMA 30) hovered at around 643,507 on August 9, the network’s activity had tanked by 78,248 unique accounts, representing a 10.84% slide.
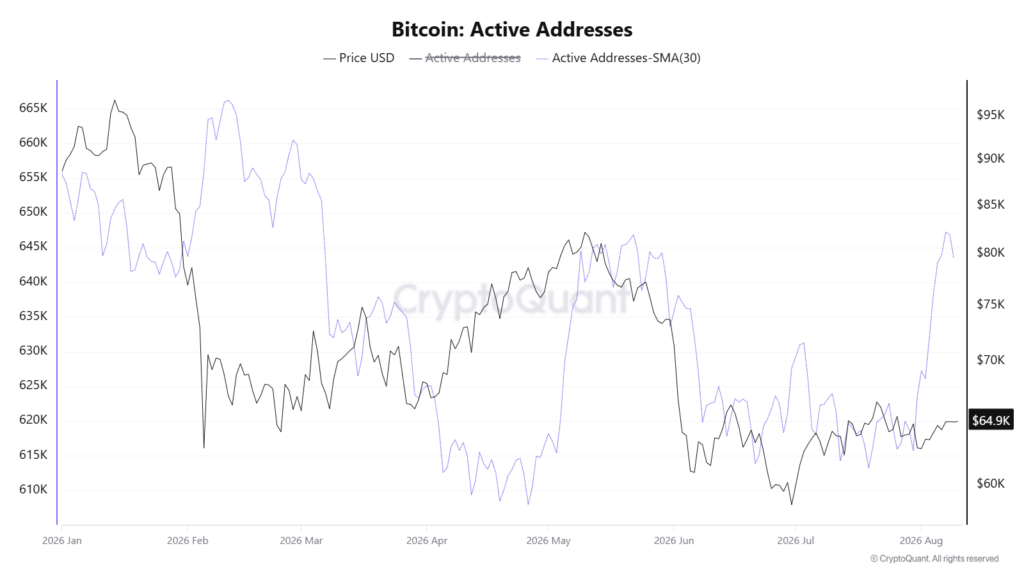 Bitcoin active addresses SMA (30) YTD chart. Source: CryptoQuant
Nonetheless, it is worth noting that Bitcoin’s active address SMA(30) has risen to the highest level since May 29, 2026, signaling a renewed wave of adoption.
Bitcoin price outlook
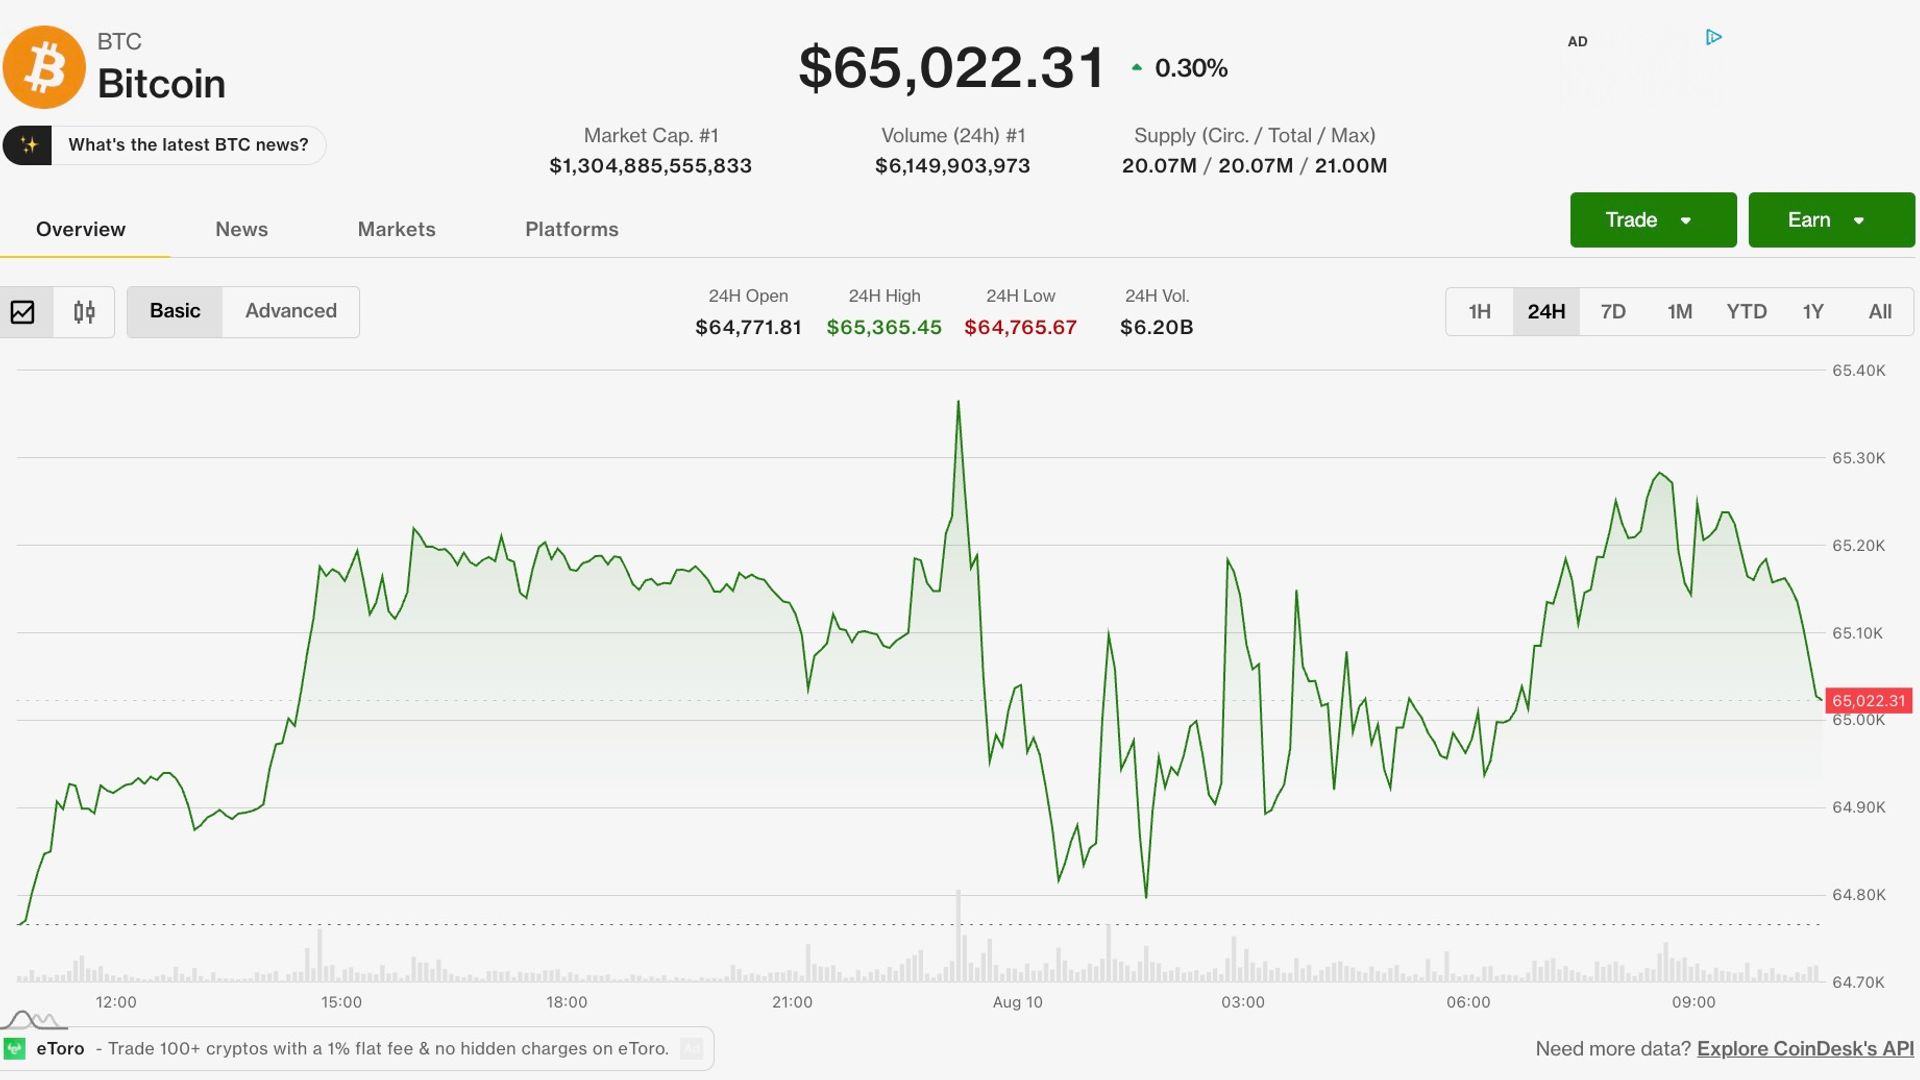
Year-to-date (YTD), BTC price has plummeted by more than 25%, trading at $64,960 at press time. During the past 24 hours, the flagship coin has added 0.2%, with its trading volume $15.4 billion, up over 23% on the day.
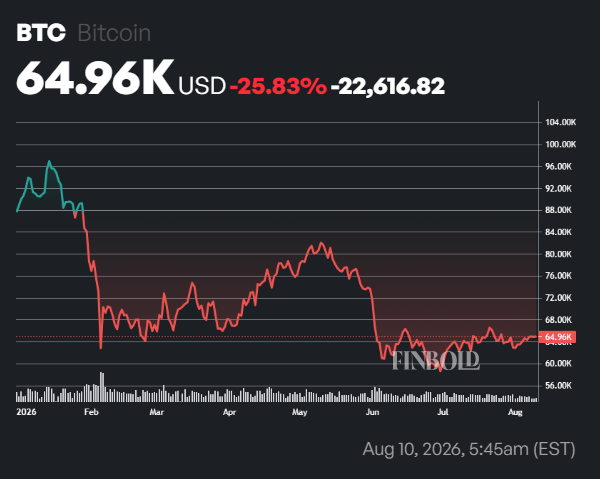 BTC/USD YTD chart. Source: Finbold
The renewed spike in BTC’s active addresses has coincided with recent bullish sentiment, fueled by institutional purchases, as Finbold reported. As such, if Bitcoin active addresses continue to increase in the coming weeks and months, the bullish momentum could strengthen, similar to the post-2018/2019 bottoming, which coincided with a bull rally to a new all-time high.
The post Bitcoin active addresses crash to lowest level since 2018 appeared first on Finbold.
















 English (US)