
 1 month ago
8283
1 month ago
8283

The post Bitcoin Price Just Had Its Worst Q4 Since 2018. Is This a Market Breakdown or a Rest? appeared first on Coinpedia Fintech News
Bitcoin’s price action in Q4 2025 has looked very different from previous years. After starting the quarter in a strong uptrend and pushing into fresh all-time highs early on, momentum shifted sharply as the quarter progressed. Instead of the usual year-end acceleration, price action turned corrective, with rallies sold into and volatility expanding to the downside. This change in trend has made Q4 2025 one of the most structurally unusual fourth quarters Bitcoin has seen in years.
Why Q4 2025 Broke the Historical Pattern
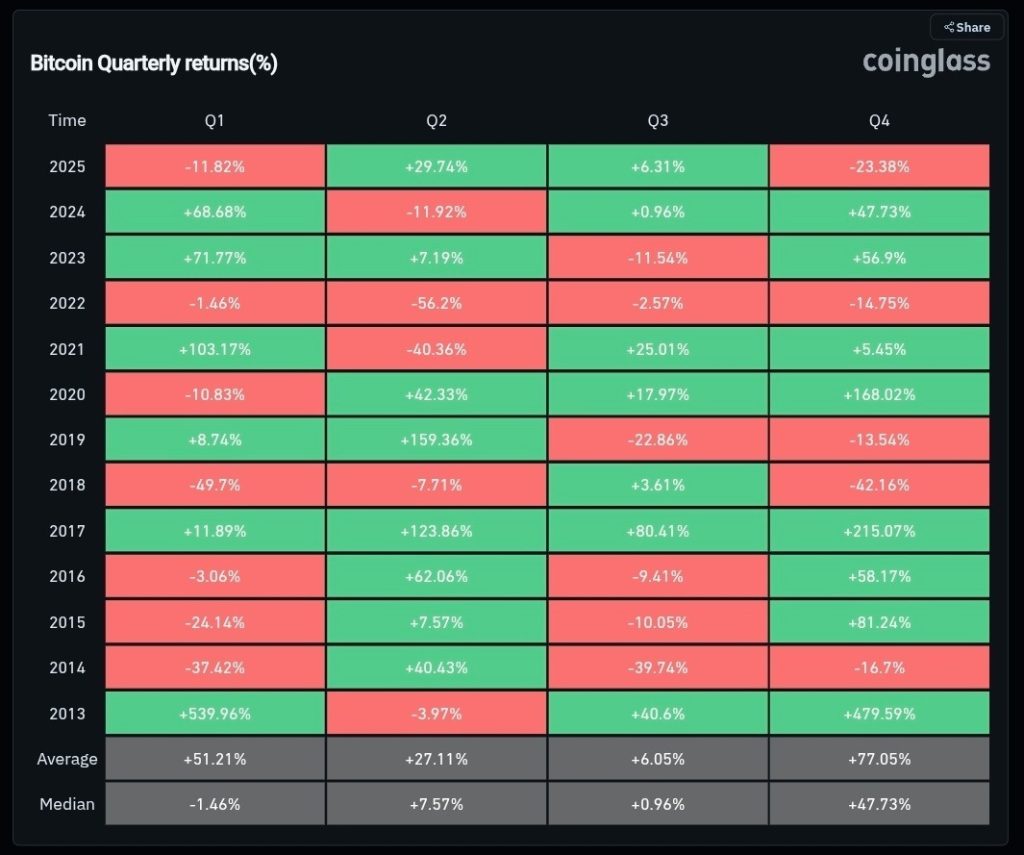
Bitcoin has closed Q4 2025 down nearly 23.8%, marking its second-worst fourth quarter on record, beaten only by the brutal 2018 Q4 crash (-42%). The drawdown stands in sharp contrast to history: Bitcoin’s average Q4 return is around +77%, making this year’s performance a major statistical outlier.
But context matters. This decline did not come from weakness at the lows—it followed a cycle peak near $126,000 in October, when optimism, leverage, and positioning peaked far earlier than usual.
Bitcoin reached a new all-time high in October, pulling forward gains that historically arrive much later in the cycle. That rally was accompanied by elevated funding rates, aggressive derivatives positioning, and crowded long exposure. Once upside momentum slowed, profit-taking and forced deleveraging took over, creating a self-reinforcing downside move. In other words, Q4 didn’t fail because demand disappeared—it failed because positioning got ahead of structure.
What’s Next for the Bitcoin (BTC) Price Rally Ahead of the 2025 End
Bitcoin’s price action in Q4 2025 has shifted from expansion to correction, and the daily chart captures that transition clearly. After setting a cycle high in October, BTC entered a sustained downtrend marked by lower highs and heavy sell pressure. Price is now consolidating near a critical demand zone, making this phase less about upside momentum and more about whether the market is stabilising after a sharp leverage-driven reset.
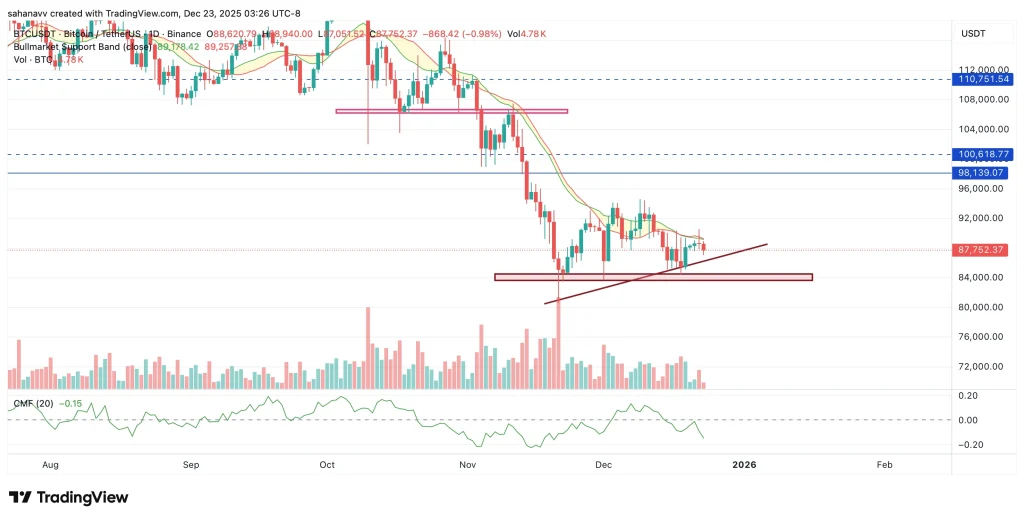
The chart shows BTC trading below the Bull Market Support Band, a sign that bullish momentum has weakened in Q4. Price is compressing above a rising trendline and horizontal demand zone near the mid-$80,000s, suggesting buyers are defending support. However, volume remains muted, and the Chaikin Money Flow (CMF) is negative, indicating capital outflows persist.
Together, this suggests Bitcoin is in a pause phase rather than a recovery phase. Price is holding key demand, but the lack of strong volume expansion and the negative CMF reading indicate buyers are still cautious. Until BTC reclaims the Bull Market Support Band with improving money flow, the structure remains one of controlled consolidation under pressure, not a confirmed trend reversal.
Conclusion
Bitcoin’s Q4 correction has shifted the focus from upside expansion to structural defence. As long as BTC holds the $84,000–$86,000 demand zone, the current move looks like consolidation after a leverage reset rather than a full trend breakdown. A sustained recovery would require reclaiming $92,000, followed by acceptance above $98,000–$100,000, where prior support turned resistance. If those levels are regained by year-end, bullish 2025 price projections remain valid—though the market is clearly signaling a slower, more volatile path forward.


 English (US)