
 58 minutes ago
797
58 minutes ago
797
.png)
The Bitcoin Rainbow Chart indicates that Bitcoin (BTC) could trade around $63,800 at the start of September 2026, based on the model’s current trajectory.
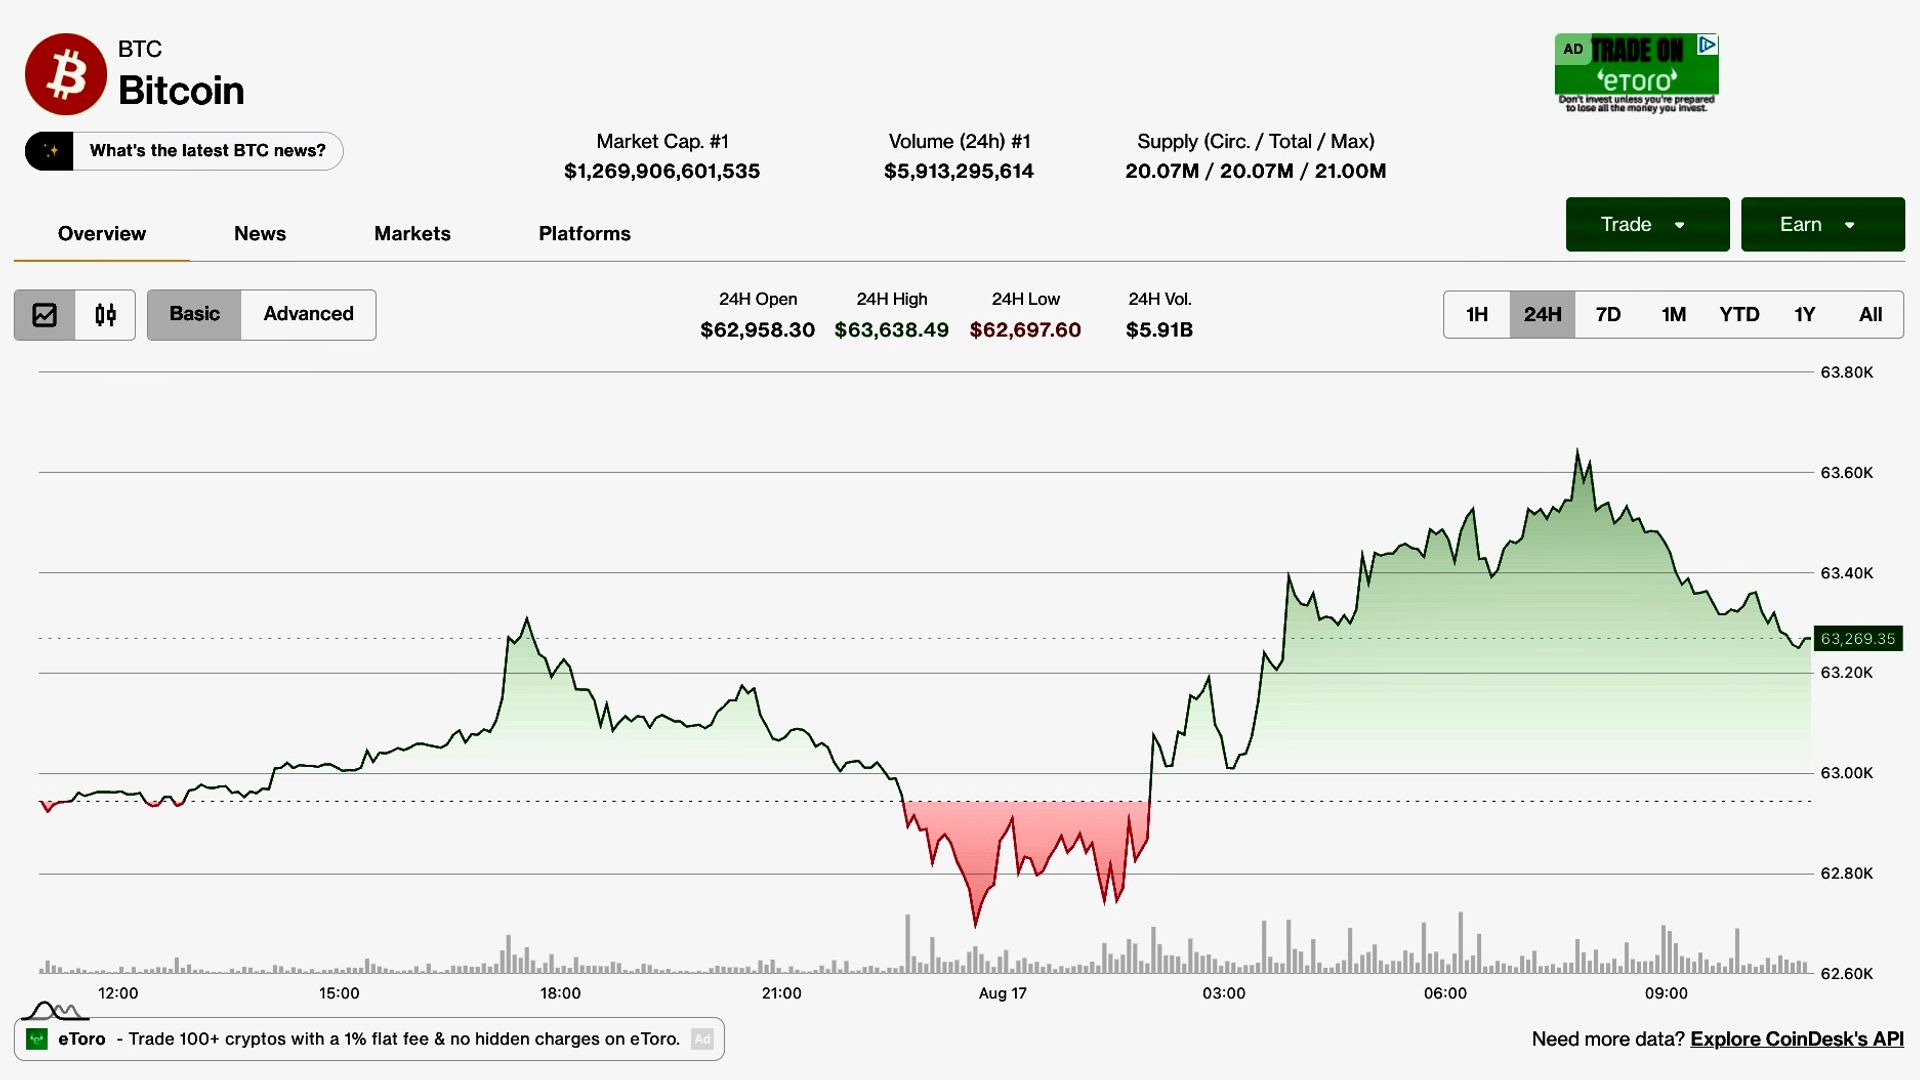
With Bitcoin changing hands at $63,258 at press time, the forecast implies a modest gain of less than 1% over the next two weeks.
The Rainbow Chart is a long-term valuation model that maps Bitcoin’s historical price action against a logarithmic growth curve to indicate whether BTC appears overvalued or undervalued relative to past market cycles.
Based on the chart’s current trajectory, Bitcoin is trading near the lower end of its historical valuation range, with the model implying a price of roughly $63,800 by early September. However, the Rainbow Chart is best viewed as a long-term valuation tool rather than a precise forecasting model.
The latest data also shows the cryptocurrency trading below the original chart’s lowest band, a zone BlockchainCenter labels “Bitcoin is dead.” Historically, similar periods have reflected extreme market pessimism and have often preceded long-term recoveries.
Notably, the Rainbow Chart divides Bitcoin’s valuation into color-coded bands representing different market conditions.
Bitcoin price prediction
Based on the model’s September 2027 projections, ‘Maximum Bubble Territory’ begins around $1.83 million and signals extreme market euphoria often associated with cycle tops. ‘Sell. Seriously, SELL!’ starts near $1.34 million and indicates substantial overvaluation.
‘FOMO Intensifies’, around $984,000, reflects aggressive speculative buying, while ‘Is This a Bubble?’, near $734,000, suggests strong bullish momentum alongside growing concerns about sustainability.
In the middle of the range, ‘HODL!’ sits around $532,000 and represents a historically neutral valuation zone for long-term holders. ‘Still Cheap’, near $385,000, indicates Bitcoin remains attractively valued despite previous gains.
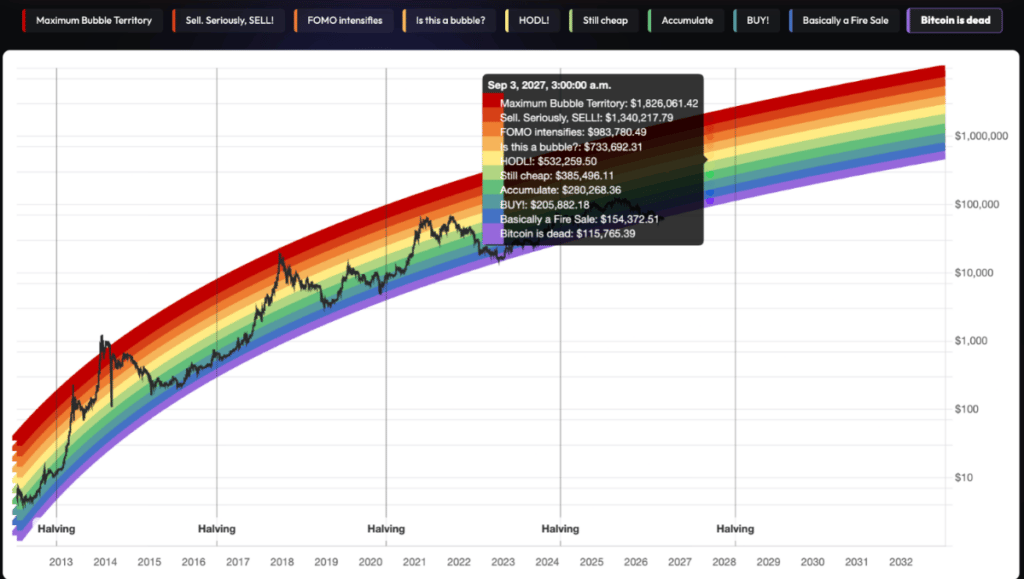 Bitcoin Rainbow Chart. Source: Blockchain Center
‘Accumulate’, around $280,000, has historically been associated with favorable long-term buying opportunities, while ‘BUY!’, near $206,000, signals deep-value conditions during market downturns.
Closer to the bottom of the chart, ‘Basically a Fire Sale’ begins around $154,000 and reflects periods of severe market weakness. The lowest band, ‘Bitcoin is Dead’, starts near $116,000 and represents extreme pessimism and capitulation, conditions that have historically emerged near major bear-market lows.
These figures are not price targets. Rather, they illustrate how the Rainbow Chart’s valuation framework shifts higher over time as Bitcoin’s long-term growth trend advances.
Featured image via Shutterstock
The post Bitcoin Rainbow Chart predicts BTC price for start of September appeared first on Finbold.
















 English (US)