
 1 month ago
9656
1 month ago
9656
.png)
Bitcoin‘s price recently hovered around the $64,880 mark, exhibiting mixed technical signals as it faces notable resistance. After briefly surpassing $66,300, downward pressure resumed, causing a session loss near 1.8%. Bitcoin’s struggle to establish a sustained upward momentum raises questions about potential market movements.
Why Is $64,900 a Crucial Threshold?
The $64,900 zone emerges as a pivotal point for Bitcoin, as pointed out by various technical analyses. Insights drawn from a 4-hour chart utilizing Elliott Wave theory and Fibonacci levels establish $64,911 as a significant resistance, with $63,669 identified as critical support. If the cryptocurrency holds above this support level, potential targets may range between $69,687 and $73,240.
However, dropping beneath $63,669 could trigger a further decline, impacting sentiment adversely. Recent attempts to move past $66,000 have faltered due to an inability of buyers to secure a prolonged breakout.
“Technical frameworks highlight $64,900 as a critical resistance zone, while $63,669 remains essential support. Unless buyers reclaim lost ground decisively, Bitcoin risks a retreat towards lower ranges, according to leading analysts.”
The advent of sophisticated tools such as CryptoAppsy has become crucial for traders. This app consolidates real-time prices, market charts, and portfolio insights, ensuring users stay informed and responsive to rapid market shifts through smart alerts and strategic insights.
What Role Does the $63,000 Zone Play?
The trading cluster between $63,111 and $61,840 holds historical importance, having seen over 1.3 million BTC transactions. This area may attract new buying interest if prices approach, acting not as a strict support but as a dynamic contesting ground.
Similarly, any advances above immediate resistance could face a lesser supply push until reaching around $84,569, indicating a potential for broader upward momentum.

“Should Bitcoin move below $63,669, analysts are likely to pay close attention to the $63,111–$61,840 band, a range underpinned by large historical trading volumes and active on-chain participation.”
Technical Signals: What Are They Saying?
Current oscillators showcase a neutral outlook, with the 14-day RSI posting 53.10, indicating an equilibrium between buyers and sellers. Similarly, tools like the Stochastic indicators suggest neutrality, while momentum metrics hint at modest optimism.
In contrast, bearish forces still show presence, revealing that the market sentiment remains split on short-term directions.
Moving Averages Signal Ambiguity
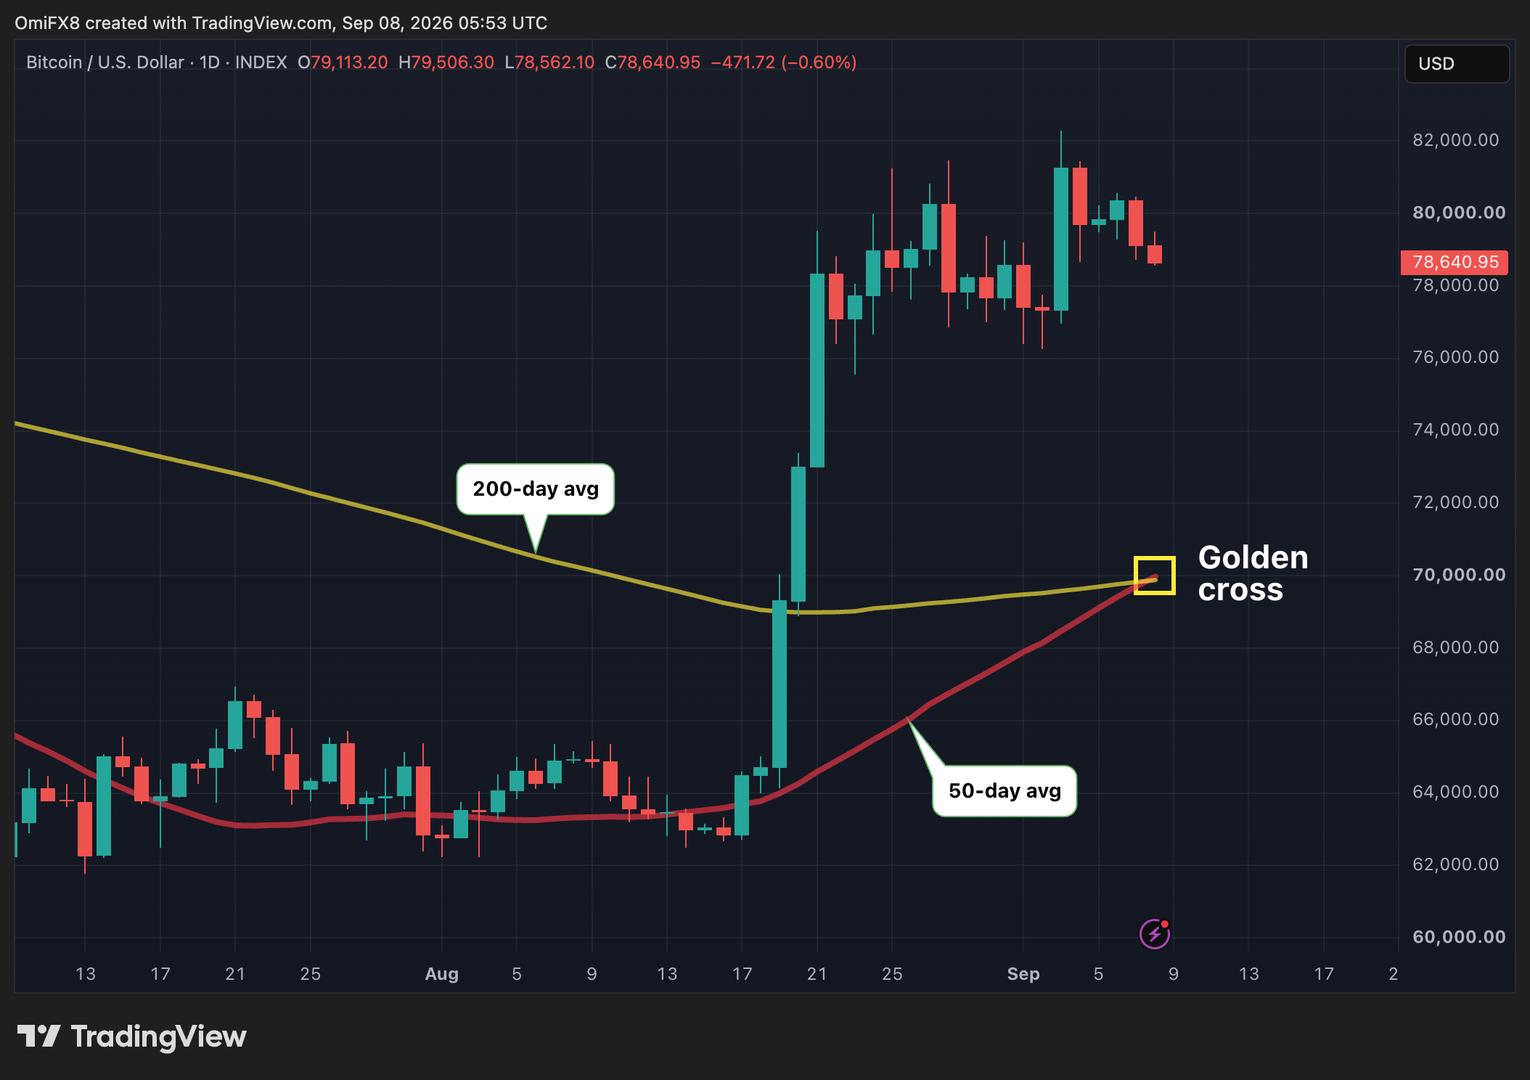
Mixed signals from moving averages indicate indecisiveness in the market. While short-term averages nearby $64,900 suggest caution, longer-term averages maintain a watchful stance, reinforcing that deeper bullish momentum hinges on regaining upper thresholds around $67,000 to $73,000.
Continued tests of $64,900 resistance and potential breaches of $63,669 support could shift focus to transactional zones like $63,111–$61,840. Successfully surpassing resistance, though challenging, could pave the way to targets reaching $73,240.
- Bitcoin’s price presents mixed technical indicators amidst resistance and support tension.
- $64,900 stands as a critical resistance level following brief rises above $66,000.
- Breaking below $63,669 could lead to bearish momentum, while overcoming resistance may open paths to higher targets.
Currently, the market’s volatility is pronounced, with Bitcoin’s price fluctuating between new breakout attempts and resistance challenges. Traders remain vigilant as potential decisive movements loom, determining Bitcoin’s next trajectory in upcoming sessions.










 English (US)