
 2 hours ago
285
2 hours ago
285


The post Does MVRV Z-Score Reset Hints Stability for MYX Price or Drop Toward $1 Next? appeared first on Coinpedia Fintech News
Today, the MYX price didn’t just dip; it showed a brutal long squeeze that triggered around 50% collapse, wiping out overheated positioning in a short amount of time and sending liquidation data flashing red across derivatives dashboards.
According to Coinglass, total liquidations rekt over the past 24 hours reached $615.96K. Longs took the real hit $527.13K flushed, while shorts accounted for just $88.83K. That imbalance tells a clear story of a token dump. This wasn’t a balanced deleveraging; it seemed like a strategic one-sided unwind to extract most of the profits.
Liquidations Tell the Story in MYX Price
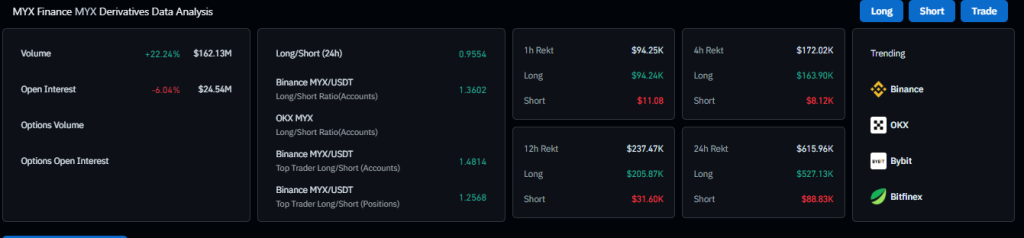
When long liquidations outweigh shorts nearly five to one, it usually means traders were leaning too hard in one direction.
The onchain data confirms that they truly were leaning too much on the bullish side. Per Santiment’s data, the MYX price had previously pushed the MVRV Z-Score to 4.731, which seemed to be in a danger zone, as this metric had been rising and hadn’t risen much beyond 4.731 which showed that was the limit of previous bullish rise.
That reading suggests market value had detached sharply from holders’ cost basis. In simpler terms, there were too many paper profits and markets covered that gap by this dump. As there was too much heat.
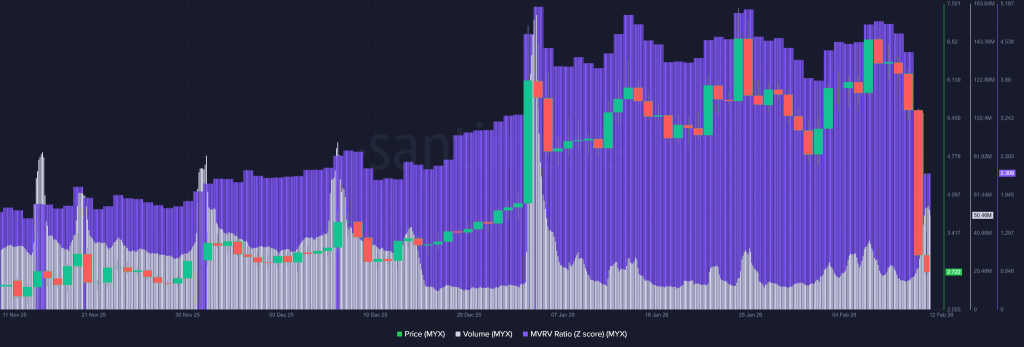
As a reason, the Z-score collapsed to 2.309 alongside a 50% price drawdown and surging volume. That’s not random volatility, in fact, the data points out that’s a violent shift from speculative euphoria to something closer to fair value. Massive unrealized gains got flushed out. Weak hands exited under pressure. Supply changed hands.
Well, here’s the kicker: that kind of washout can either mark the end for crypto or the reset before a base forms. Based on what the MYX price chart displays, it seems it is more interested in developing a base around $2.50-$3.00, aligning with an ascending trendline that’s been present for months.
MVRV Reset in Motion
A drop from 4.731 to 2.309 doesn’t scream bullish continuation, but it doesn’t scream structural death either. Historically, extreme Z-scores leave little room for sustainability. Pullbacks are common.
Now the market sits in a more neutral-bullish range, at least statistically speaking.
And that spike in volume during the drawdown? Classic capitulation behavior. It often accompanies panic-driven exits. But let’s be real, it also signals the market has aggressively repriced risk.
$3 Support Under Pressure
Technically, the MYX price chart shows the collapse reaching an ascending trendline support near $2.50-$3.0. That level matters. So far, it’s holding at CMP at $2.65, when writing.
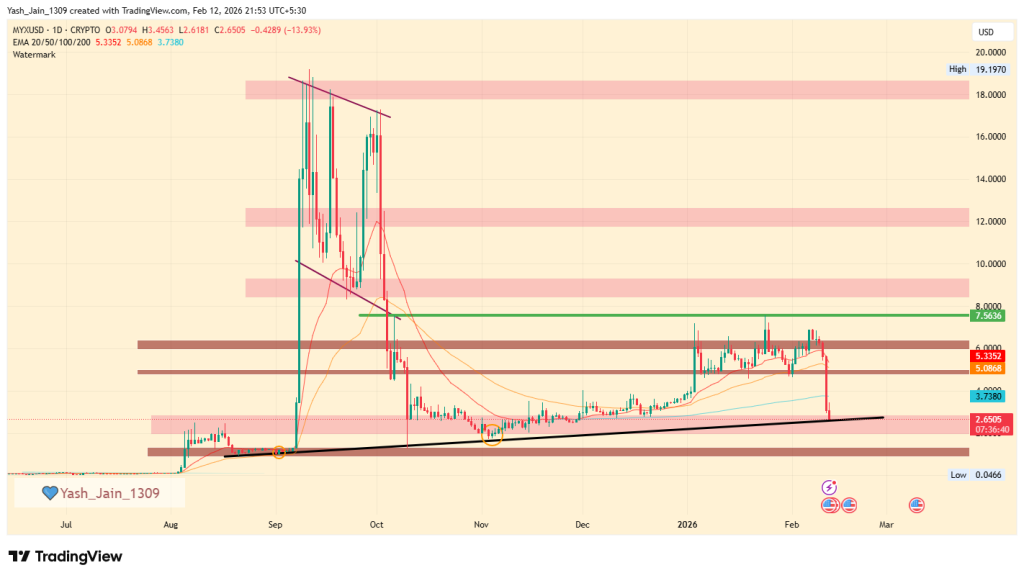
But, If $3.0 breaks decisively, downside toward $1.0 becomes a realistic extension of the bearish outlook. No sugarcoating that. However, if consolidation builds around current levels and demand gradually returns, the foundation for recovery could form.
The MYX price prediction now hinges on whether this support becomes accumulation or surrender.
Utility Concerns Emerge
And then there’s the uncomfortable detail. Lower daily exchange activity appears to have played a role too in a recent dump. Because, MYX’s utility is driven by trading activity on its platform. Recent dashboard data shows declining open interest across key pairs like BTC/USDT and ETH/USDT.
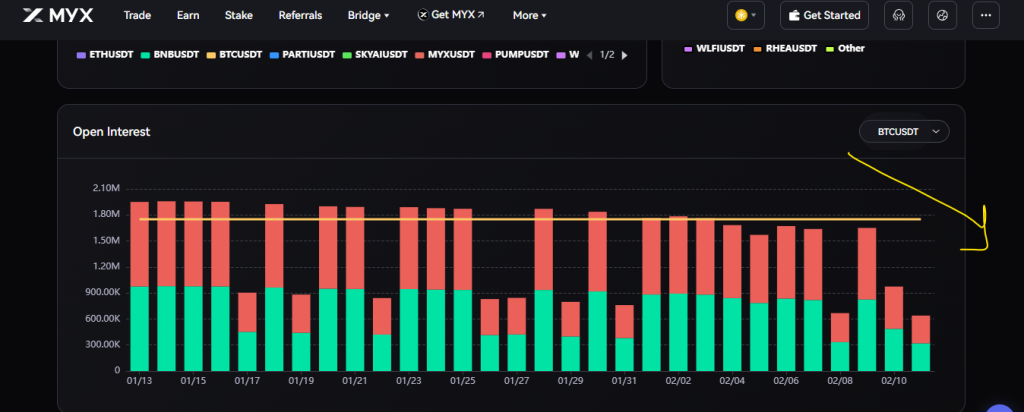
Less activity. Less utility demand. Investors noticed and they basically dumped.
So while the long squeeze triggered the collapse, slowing exchange momentum may have lit the fuse. Whether that trend stabilizes could determine what happens next for MYX price.


 English (US)