
 1 month ago
7235
1 month ago
7235


The post Ethereum Price Remains Below $3,000 — Is a Breakout Still Possible in Early 2026? appeared first on Coinpedia Fintech News
The top two cryptos, Bitcoin and Ethereum, continue to trade below their respective resistance levels, which have now become the barrier to break. The second-largest token has been trading between $2900 and $3000 for nearly a month, extending a broad consolidation phase that has persisted for months. While short-term price action remains muted, higher-timeframe structure and derivatives positioning suggest the ETH price may be approaching a decisive phase. However, it would be interesting to watch whether the bulls can break the $3200 barrier in the coming days.
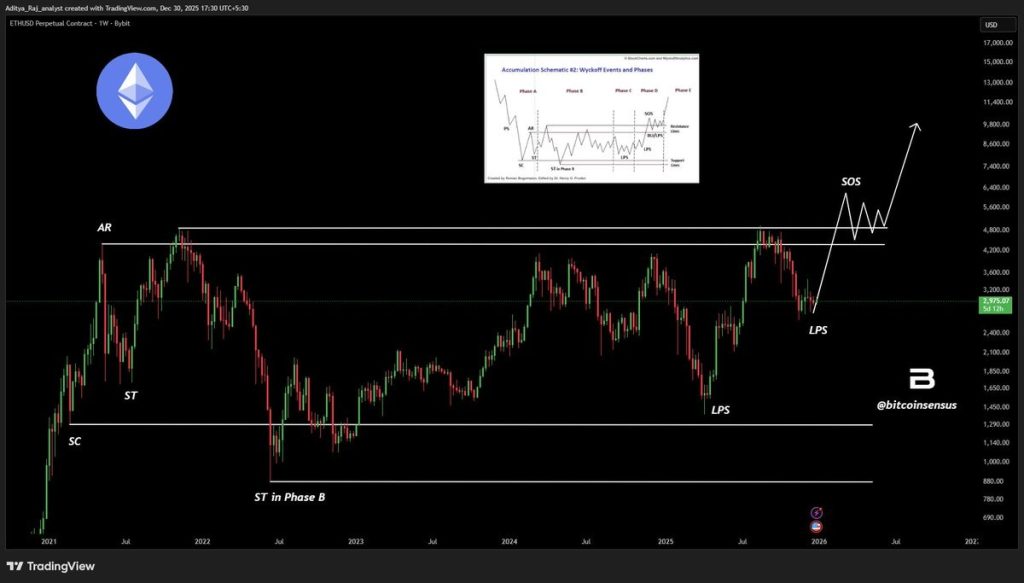
Ethereum’s Wyckoff Structure Still Favors Accumulation
On the higher timeframe, Ethereum continues to exhibit characteristics of a Wyckoff Accumulation structure. After the Selling Climax (SC) and Automatic Rally (AR) phases, ETH spent an extended period in Phase B, marked by volatility and repeated tests of demand.
 Source: X
More recently, price has formed a Last Point of Support (LPS), with ETH holding above key demand zones near the $2,800–$2,900 region. Pullbacks are becoming more controlled, suggesting selling pressure is being absorbed rather than expanded. This behavior aligns with Wyckoff Phase D, where accumulation nears completion.
That said, the structure remains incomplete without confirmation. A true Sign of Strength (SOS) requires a decisive breakout and acceptance above the long-term resistance near $4,800.
Liquidity Map Signals High Volatility Risk Near Current Prices
At current prices near $3,000, Ethereum is sitting in the middle of a heavily leveraged zone. The liquidation map from Coinglass shows that a large concentration of positions is clustered both above and below the spot price, making ETH increasingly sensitive to directional moves.
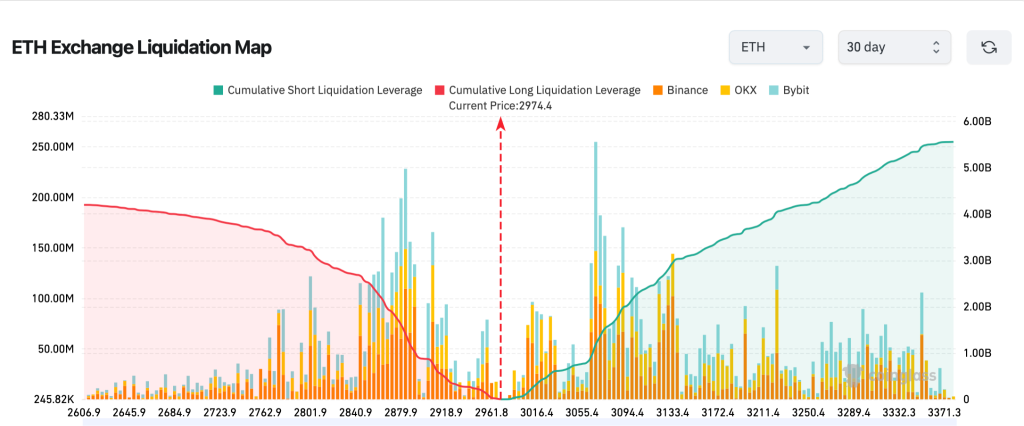
Roughly $4.54 billion in short positions would be liquidated if Ethereum rallies by around 10%, while close to $4.05 billion in long positions face liquidation on a similar downside move. This near balance in leverage suggests the market is crowded and indecisive, rather than positioned for a clean trend.
When liquidity is stacked this evenly, price often remains compressed until a catalyst or structural break forces one side to unwind. Once that happens, the resulting liquidations can amplify momentum quickly, leading to sharp and fast moves rather than gradual price transitions.
Here Are The Two Scenarios Traders Need to Watch Next
As seen in the weekly chart below, the ETH price has been closely consolidating within a very narrow range for several weeks. However, the ascending pattern has been held finely, indicating the possibility of a bullish continuation. In times when the volatility is squeezed as the traders are turning indecisive, technicals are slowly turning bullish.
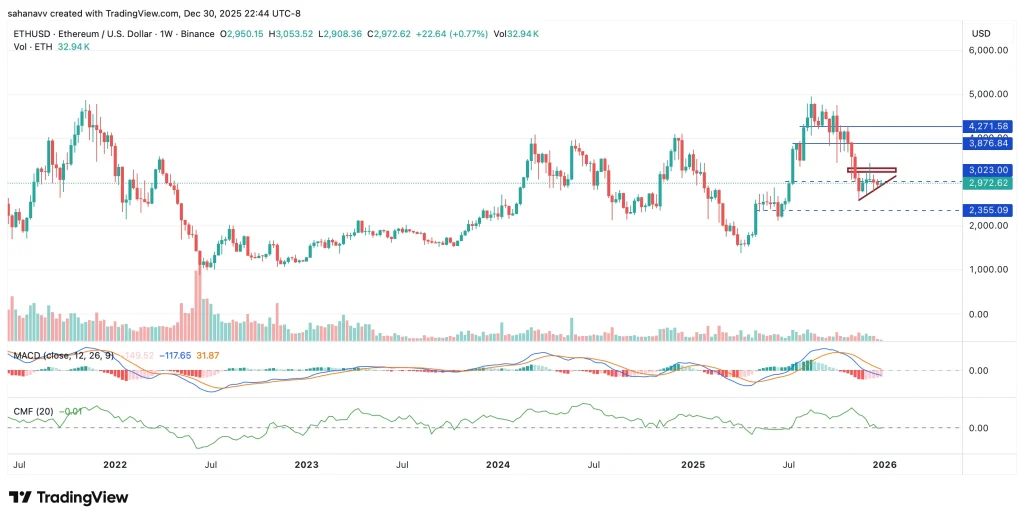
The weekly MACD shows a drop in the selling pressure, and the levels are heading for a bullish crossover. On the other hand, the Chainkin Money Flow (CMF) has displayed a bullish divergence after hitting the average zone at 0. This suggests the liquidity is entering the crypto, which has kept the levels close to the psychological barrier at $3000 without dragging the levels below $2800. Here’s what could be next for the ETH price rally.
Therefore, if the ETH price manages to hold the current range, a breakout could be imminent in early 2026 that may push the token close to $3500. However, a decisive close above $3800 may validate a reversal to $4000 and complete the Wyckoff framework. On the contrary, a failure could extend the consolidation until the market trend flips.


 English (US)