
 20 hours ago
1020
20 hours ago
1020


The post Ethereum Weekly Chart Tightens Near Resistance—Is a Major Move Coming for ETH Price? appeared first on Coinpedia Fintech News
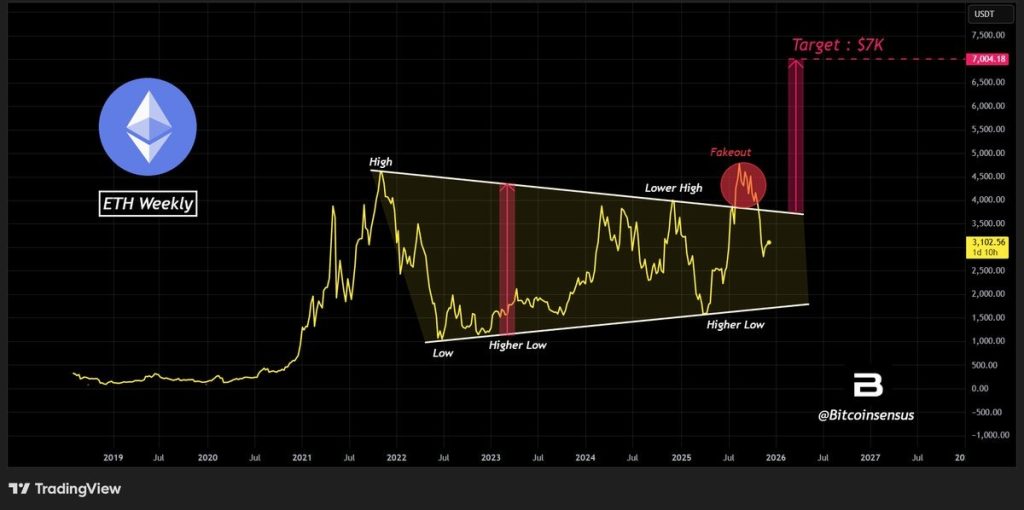
The Ethereum price is approaching a decisive moment on the weekly timeframe, where long-term structure matters more than short-term volatility. After spending years building higher lows inside a rising channel, ETH recently attempted a breakout above resistance—only to be rejected. That rejection has not broken the structure, but it has raised the stakes. The market is now compressing again, and traders are watching closely for confirmation rather than anticipation.
Ethereum’s Weekly Market Structure Shows Compression, Not Weakness
On the weekly chart, Ethereum continues to respect a multi-year rising channel that has been intact since the 2022 cycle low. Each major correction has produced a higher low, signaling sustained demand at progressively higher prices. At the same time, ETH has struggled to clear a long-term resistance trendline, creating a tightening range.
 Source: X
This combination—rising support and capped upside—is a classic volatility compression structure. Markets do not stay compressed indefinitely. They eventually expand, often sharply, once one side gives way. Importantly, ETH has not broken below its rising support. As long as this higher-low structure holds, the broader bullish bias on the weekly timeframe remains intact.
The Fakeout Above Resistance: Why It Matters More Than It Hurts
The recent move above resistance, followed by rejection, may look bearish at first glance. In reality, fakeouts are common near major turning points.
Such moves tend to:
- Flush late long positions
- Reset funding and leverage
- Shift sentiment from confidence to caution
These conditions often prepare the ground for the real move, rather than invalidate the setup. What matters is not the failed breakout itself, but how the price behaves afterwards. So far, Ethereum has absorbed the rejection without collapsing through key support—a sign of resilience rather than weakness.
Key Weekly Levels, Scenarios, and What Traders Should Watch Next
Ethereum remains compressed between rising support and long-term resistance. The most important signal traders are watching is a clean weekly close above the upper trendline, not just a brief wick. Such a close would confirm a structural breakout and could unlock a measured move toward the $6,500–$7,000 region, in line with long-term projections shown on the chart.
On the other hand, repeated rejection near resistance or a decisive loss of the rising channel support would weaken the bullish structure. That scenario would likely result in extended consolidation or a deeper corrective phase, delaying any upside expansion.
Until one of these outcomes is confirmed, traders should expect volatility without clear direction. Weekly closes will carry far more weight than intraday moves, and patience remains critical at this stage of the structure.
Conclusion
Ethereum’s weekly chart is approaching resolution after years of compression. The recent fakeout has not invalidated the long-term setup, but it has made confirmation essential. A decisive weekly breakout would mark a major shift in market structure, while failure would keep the ETH price range-bound. Until that confirmation arrives, volatility is likely—and discipline matters more than prediction.


 English (US)