
 1 hour ago
544
1 hour ago
544
.png)
Bitcoin enthusiasts have witnessed a significant development as a crucial long-term threshold has been surpassed in the cryptocurrency market. The 200-week moving average, recognized as a fundamental long-term support indicator for Bitcoin, has climbed past the $65,000 mark.
What Does the New Long-Term Threshold Mean?
The latest data revealed by Blockstream CEO Adam Back highlights this noteworthy level. According to the shared chart based on Look Into Bitcoin data, the 200-week average, which hovered around $64,000 in August, managed to reach a new peak within just a month.
Blockstream, renowned for its technologies focusing on Bitcoin infrastructure and corporate solutions, is led by Adam Back, a prominent figure in cryptography and a veteran in the Bitcoin ecosystem. His analysis emphasizes that Bitcoin’s mathematical foundation has achieved a historic peak, indicating continuous reinforcement of its long-term framework.
Decoding the 200-Week Moving Average?
The 200-week moving average offers a glimpse into Bitcoin’s long-term trends by focusing on the asset’s price movements over the past four years. This duration typically aligns with a market cycle, providing an effective measure that filters out short-term fluctuations and daily price noise.
Historically, this level has acted as a robust support zone for Bitcoin. During previous bear markets, instances of prices dipping below this line were rare and predominantly coincided with significant global economic disruptions.
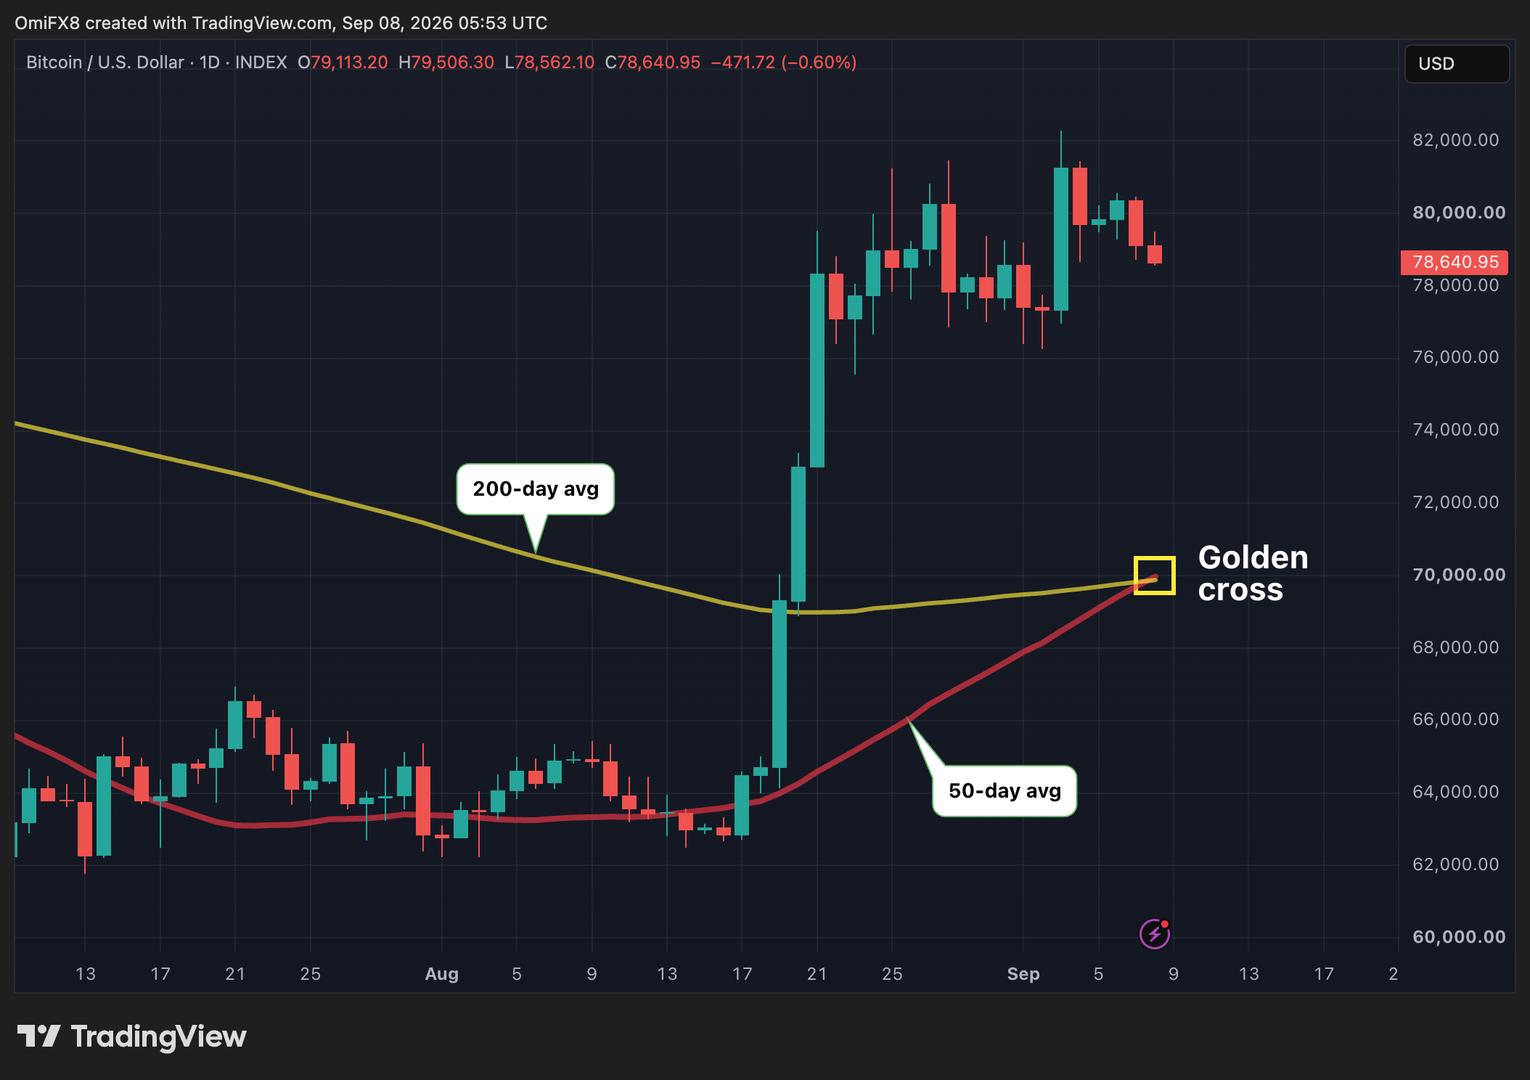
In the spot market, Bitcoin is maintaining a price range between $76,000 and $77,000, significantly above the 200-week average. Such disparity suggests that the selling pressure is well above the historic support level, attributed to long-term investors absorbing market supply, thereby strengthening the support line.

- The 200-week average surpassing $65,000 indicates Bitcoin’s reduced likelihood of sustaining lower levels.
- Spot prices highlight a wide gap with historical averages, reinforcing strength in Bitcoin’s support.
- Analyses point to a diminishing possibility of revisiting the $60,000 to $64,000 range if current trends persist.
With these developments, the likelihood of Bitcoin experiencing a downfall below this newly achieved benchmark is decreasing, prompting a positive sentiment among some market participants. Analysts suggest the asset’s upward momentum is more aligned with cycle-based mathematical trends rather than short-term price movements.












 English (US)