
 1 month ago
8213
1 month ago
8213

The post SUI Price Nears Key Breakout Zone as On-Chain Activity Picks Up—Will it $2? appeared first on Coinpedia Fintech News
The bulls seem to have reinforced since the start of 2026 as traders have turned optimistic about the upcoming price action. Bitcoin spiked above $90,000, and despite a small pullback, it continues to hover close to the range. Meanwhile, Ethereum sustains above $3000 while the XRP price displayed a huge upside move and flipped BNB to gain the 4th spot in the crypto rankings. Besides, the SUI price is quietly setting up a critical technical level and is holding a tight consolidation range that could define the next major move.
On-Chain Data Shows Early Signs of Strength
Recent DeFiLlama data highlights a divergence between Total Value Locked (TVL) and decentralized exchange (DEX) volume, offering insight into current market sentiment. TVL has stabilized near the $900 million–$950 million range after a sharp December decline, suggesting capital outflows have slowed and the market is entering a consolidation phase.
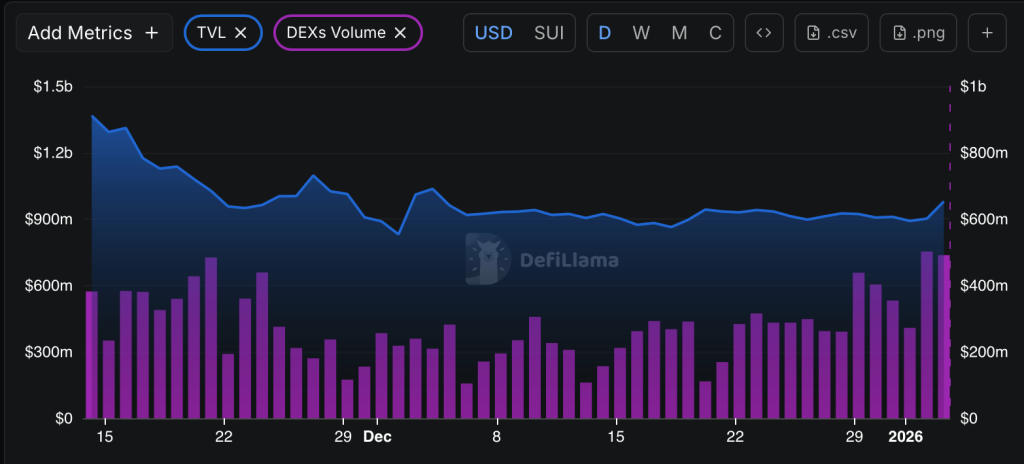
Meanwhile, DEX trading volumes have increased into early 2026, indicating renewed trader activity and short-term speculation. The rise in volume without a corresponding TVL increase suggests capital rotation within DeFi rather than fresh inflows.
Historically, this setup often appears near local bottoms or during early trend transitions. While higher volumes may support short-term price rallies and volatility, a sustained bullish DeFi move will likely require a clear recovery in TVL to confirm long-term investor confidence.
Is SUI Price Forming a Base? Chart Signals Hint at Short-Term Rebound
The SUI/USDT daily chart shows the token attempting to stabilize after a sharp sell-off in Q4 2025. Following a steep breakdown from the $3.00–$3.50 range, price action has compressed into a narrowing structure near recent lows. Momentum indicators and volume suggest selling pressure has eased, while traders are closely watching whether SUI can sustain a short-term recovery. The chart highlights key resistance, support zones, and trend signals shaping near-term price direction.
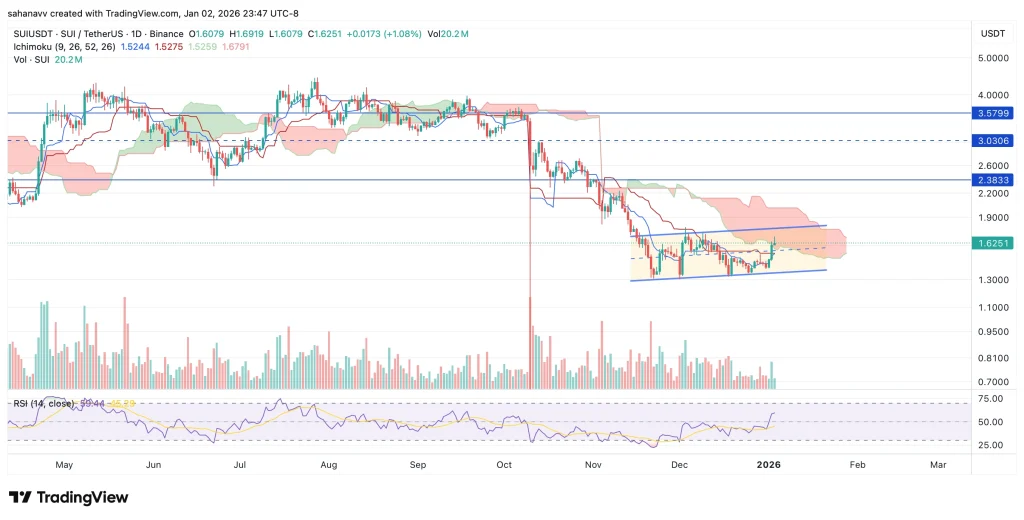
SUI is trading around $1.62, consolidating inside a descending wedge after a strong capitulation move in October. Price remains below the Ichimoku cloud, indicating the broader trend is still bearish, though the cloud is flattening. RSI has rebounded above 45, signaling improving momentum without entering overbought territory. Volume has normalized after the sell-off spike, suggesting exhaustion among sellers. A breakout above wedge resistance could open room for a short-term relief rally.
The Bottom Line
Overall, SUI appears to be in a consolidation phase following its recent sell-off, with technical indicators suggesting that downside momentum is weakening. While the broader trend remains cautious, improving RSI and price compression hint at a potential short-term move. A confirmed breakout above key resistance would be needed to validate any sustained recovery.


 English (US)