
 8 hours ago
1629
8 hours ago
1629

As Bitcoin (BTC) continues to retrace below the $70,000 level, historical indicators suggest that the asset is likely to drop further before bottoming.
In this line, the Market Value to Realized Value (MVRV) Pricing Bands, a tool used to identify periods of extreme overvaluation and undervaluation, show Bitcoin trading near levels that have historically coincided with major cycle bottoms.
As per the data shared by cryptocurrency analyst Ali Martinez in an X post on February 9, Bitcoin has repeatedly found durable lows when its price approached the −1.0 MVRV Pricing Band, a zone that reflects deep market undervaluation.
This pattern was visible during the 2015 bear market, the 2018 crypto winter, and again in 2022, each time preceding multi-month recoveries. The −1.0 band currently sits around $52,040, placing Bitcoin within a historically significant accumulation range rather than a typical correction zone.
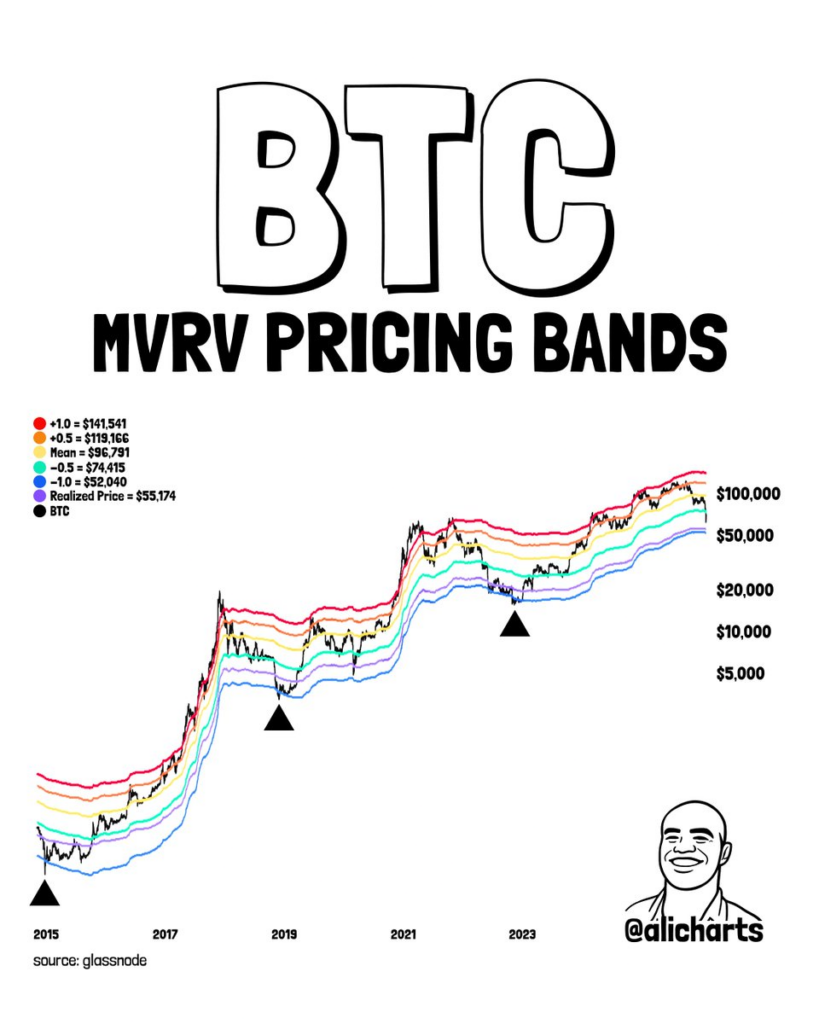 Bitcoin MVRV bands. Source: Glassnode
The MVRV indicator compares Bitcoin’s market value with its realized value, or the average on-chain cost basis. Deep drops below the long-term mean signal widespread losses, often marking capitulation.
At the current stage, the key question is whether the market’s latest pullback represents capitulation rather than the start of a deeper downturn.
By press time, Bitcoin was trading at $69,279, having corrected by over 2.6% in the past 24 hours, while on the weekly timeframe, the cryptocurrency is down 12%.
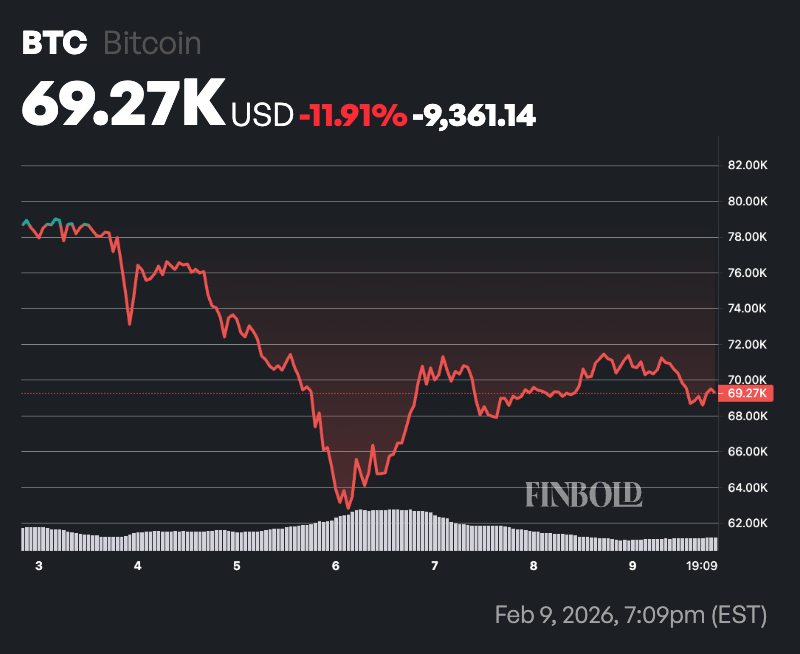 Bitcoin seven-day price chart. Source: Finbold
Bitcoin fundamentals
Notably, Bitcoin has made a partial recovery after a volatile period in which the cryptocurrency briefly plunged toward $60,000–$61,000, marking a roughly 50% drawdown from its all-time high of around $126,000.
It has since rebounded somewhat, reclaiming levels above $70,000 at points over the weekend, driven in part by institutional buying on the dip.
However, data on Monday indicated that institutional flows remain under pressure. As reported by Finbold, BlackRock-managed crypto products recorded more than $3.6 billion in net outflows between February 6 and 9, largely concentrated in Bitcoin and Ethereum.
The asset manager’s total crypto holdings fell to $59.7 billion, though the moves primarily reflect ETF redemptions and custody flows rather than direct market selling.
Meanwhile, despite widespread crash forecasts in early 2026, Bernstein has struck a sharply bullish tone on Bitcoin, projecting a rally to a new all-time high of $150,000 by year-end.
The firm argued that the current pullback reflects investor behavior rather than structural weakness, citing growing institutional adoption, a more favorable U.S. regulatory environment, and the absence of major industry scandals as key supports for the price outlook.
Featured image via Shutterstock
The post This historic indicator just flagged Bitcoin’s price bottom appeared first on Finbold.


 English (US)